|
|

|
|
|
|
|
CHAPTER 1 – GOALS AND
OBJECTIVES.............................................................................1-1
|
|
INTRODUCTION.............................................................................................................................
1-1 |
|
GENERAL GUIDELINES ..................................................................................................................
1-1 |
|
KEY ISSUES...................................................................................................................................
1-2 |
|
GOALS
AND OBJECTIVES ...............................................................................................................
1-3 Goal No.
1.......................................................................................................................................................
1-4 Goal No.
2.......................................................................................................................................................
1-4 Goal No.
3.......................................................................................................................................................
1-5 Goal No.
4.......................................................................................................................................................
1-5 Goal No. 5.......................................................................................................................................................
1-6 Goal No.
6.......................................................................................................................................................
1-6 Goal No.
7.......................................................................................................................................................
1-7 Goal No.
8.......................................................................................................................................................
1-7 |
|
REGULATORY GUIDELINES ...........................................................................................................
1-8 Water
Quality..................................................................................................................................................
1-8 Historical,
Architectural, Archaeological, and Cultural Resources
............................................................... 1-9 Biotic
Communities.........................................................................................................................................
1-9 Endangered and Threatened Species
.............................................................................................................
1-10 Wetlands.........................................................................................................................................................
1-10 Floodplains ....................................................................................................................................................
1-11 Coastal Zone Management Program
.............................................................................................................
1-11 Farmland........................................................................................................................................................
1-12 |
|
MASTER PLANNING PROCESS ......................................................................................................
1-12 |
|
CHAPTER 2 – EXISTING CONDITIONS
...............................................................................
2-1 |
|
FORWARD.....................................................................................................................................
2-1 |
|
AIRPORT SETTING .........................................................................................................................
2-2 Climate............................................................................................................................................................
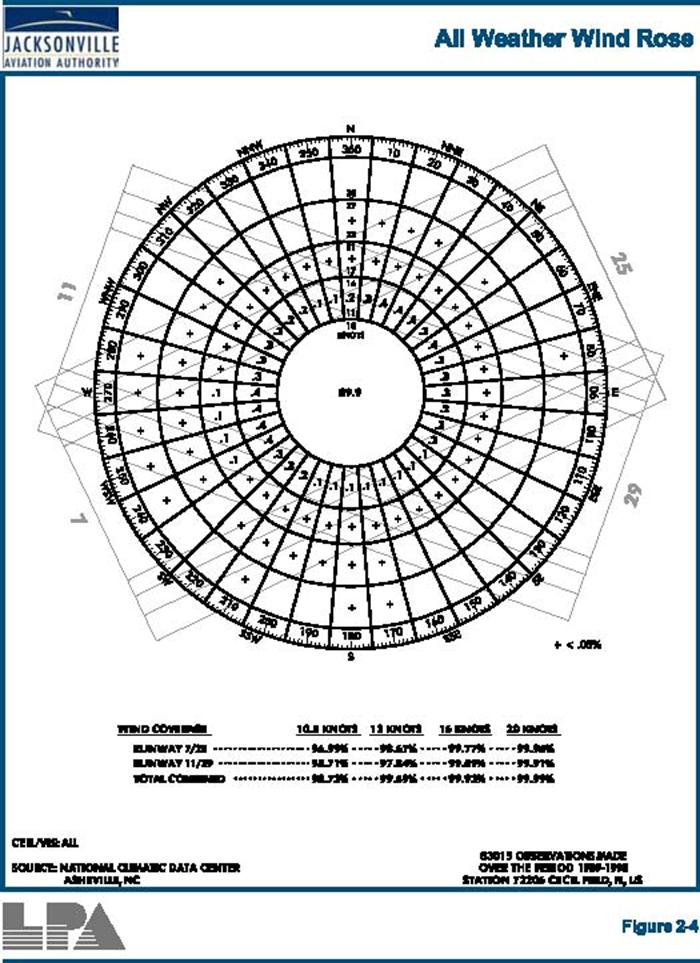
2-7 Wind Coverage
................................................................................................................................................
2-7 FAA Certification and
Classification.............................................................................................................
2-11 |
|
HISTORIC DATA ...........................................................................................................................2-12
Airport
History...............................................................................................................................................
2-12 Airport
Acreage..............................................................................................................................................
2-12 Previous Studies and
Reports.........................................................................................................................
2-13 |
|
ROLE OF AIRPORT .......................................................................................................................
2-13 Jacksonville
Airport Authority Plan/Duval County System Plans
................................................................. 2-13 Florida Aviation System Plans
(FASP)
..........................................................................................................2-13
National Plan of Integrated Airport Systems
(NPIAS)....................................................................................2-14
|
|
AIR
TRAFFIC CONTROL AND AIRSPACE STRUCTURE ....................................................................
2-15 Special Use
Airspace
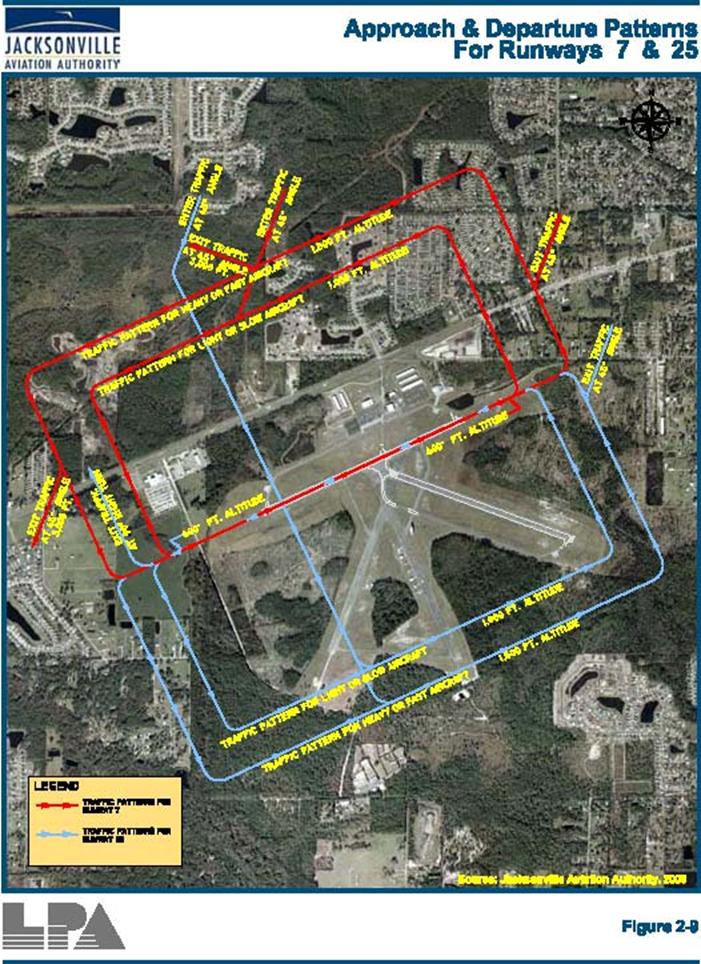
......................................................................................................................................2-16 Traffic
Pattern.................................................................................................................................................2-18
|
|
|
|
|
|
General Airport
Information...........................................................................................................................2-18 FAR Part 77 Surfaces –
Obstructions to Navigable
Airspace.........................................................................2-21
|
|
EXISTING AIRSIDE FACILITIES .....................................................................................................
2-22 Approach &
Navigational
Aids.......................................................................................................................2-23 Runways
..........................................................................................................................................................2-26
Taxiways
.........................................................................................................................................................2-27
Aircraft Apron
Facilities.................................................................................................................................2-28
|
|
EXISTING LANDSIDE FACILITIES..................................................................................................
2-29 Land Use
.........................................................................................................................................................2-29 FBO Terminal Facilities
.................................................................................................................................2-30
Surface Transportation Network.....................................................................................................................2-34
Automobile Parking
........................................................................................................................................2-34
|
|
AIRCRAFT FACILITIES ... .………………………………………………………………………. 2-35 T-Hangar
Facilities.....................................................................................
................................................... 2-35 Tenant
Facilities................................................................................................
............................................. 2-35 Off Airport
Facilities.......................................................................................
............................................... 2-36 |
|
SUPPORT FACILITIES...................................................................................................................
2-36 Fixed Base
Operator.......................................................................................................................................2-37 Fuel Facilities
.................................................................................................................................................2-37
Security ...........................................................................................................................................................2-37
Aircraft
Washrack...........................................................................................................................................2-39
Aircraft Rescue and Fire Fighting
..................................................................................................................2-39
|
|
PUBLIC UTILITIES........................................................................................................................
2-40 |
|
STORMWATER DRAINAGE ............................................................................................................2-40
|
|
EXISTING
ENVIRONMENTAL CONDITIONS....................................................................................
2-40 Water
Quality.....................................................................................
............................................................ 2-40 Historical, Architectural,
Archaeological & Cultural Resources...................
............................................... 2-41 Biotic
Communities.........................................................................................................................................
2-41 Endangered and Threatened
Species..............................................................................................................
2-43 Wetlands..............................................................................................
........................................................... 2-51 Floodplains.....................................................................................................................................................
2-54 Coastal Zone Management
Program..............................................................................................................
2-54 Farmland..............................................................................................
.......................................................... 2-54 |
|
SUMMARY OF EXISTING CONDITIONS..........................................................................................
2-56 |
|
CHAPTER 3 – AVIATION ACTIVITY FORECASTS
............................................................ 3-1 |
|
INTRODUCTION
AND BACKGROUND..............................................................................................
3-1 Historical
Sources...........................................................................................................................................
3-2 Methodology
...................................................................................................................................................
3-2 Historic Data
..................................................................................................................................................
3-3 Historic Based Aircraft
...................................................................................................................................
3-4 Historic Annual Aircraft
Operations...............................................................................................................
3-5 Previous Aviation Activity Forecasts
..............................................................................................................
3-6 |
|
FORECASTING APPROACH ...........................................................................................................
3-10 Industry Trends and
Impacts of September 11,
2001.....................................................................................
3-11 |
|
FORECAST OF BASED AIRCRAFT..................................................................................................
3-13 |
|
|
|
|
|
Aircraft Using FAA TAF Growth
Rate...........................................................................................................
3-13 Projection of
Based Aircraft Using
FASP......................................................................................................
3-14 Projection of Based Aircraft Using Historical
Growth..................................................................................
3-14 Projection of Based Aircraft Using National Forecast
Projections............................................................... 3-14
Selected Based Aircraft Forecast (Used Average Growth Rate of 1.39%)
.................................................... 3-14 Projected
Based Aircraft Fleet Mix
...............................................................................................................
3-16 |
|
FORECAST
OF AIRCRAFT OPERATIONS.........................................................................................
3-20 Forecast of GA
(Non-Military) Aircraft
Operations......................................................................................
3-20 Military
Operations........................................................................................................................................
3-23 Local Versus Itinerant Split
...........................................................................................................................
3-24 Instrument Operations Forecast
....................................................................................................................
3-25 Peak Activity Forecast ...................................................................................................................................
3-26 |
|
SUMMARY OF AVIATION FORECASTS ..........................................................................................
3-28 |
|
CHAPTER 4 – DEMAND CAPACITY AND FACILITY
REQUIREMENTS........................ 4-1 |
|
INTRODUCTION.............................................................................................................................
4-1 General.......................................................................................................................................................
4-1 Airport
Reference
Code..............................................................................................................................
4-2 |
|
AIRSPACE CAPACITY.....................................................................................................................
4-3 |
|
AIRFIELD
CAPACITY .....................................................................................................................
4-7 Airfield Operational
Capacity....................................................................................................................
4-7 Airfield
Characteristics ..............................................................................................................................
4-8 Operational
Characteristics......................................................................................................................
4-12 Hourly Capacity of
Runways.....................................................................................................................
4-15 Annual Service Volume
.............................................................................................................................
4-16 Aircraft Group Capacity
Demand.............................................................................................................
4-19 |
|
ANNUAL AIRCRAFT DELAY .........................................................................................................
4-23 |
|
SUMMARY OF AIRFIELD CAPACITY ANALYSIS .............................................................................
4-23 |
|
FACILITY REQUIREMENTS ...........................................................................................................
4-25 Airport Role and
Service
Level..................................................................................................................
4-26 |
|
AIRFIELD
FACILITIES REQUIREMENTS .........................................................................................
4-26 Runway Requirements
...............................................................................................................................
4-26 Taxiway
Requirements
..............................................................................................................................
4-30 Airfield Lighting
........................................................................................................................................
4-34 Airfield
Signage.........................................................................................................................................
4-35 Pavement Markings...................................................................................................................................
4-35 Weather Instruments
.................................................................................................................................
4-36 |
|
GENERAL AVIATION REQUIREMENTS ..........................................................................................
4-37 Hangar
Demand........................................................................................................................................
4-37 |
|
Aircraft
Parking Apron
.............................................................................................................................
4-44 |
|
AIRPORT ACCESS ........................................................................................................................
4-50 |
|
AIRPORT
SUPPORT FACILITIES.....................................................................................................
4-51 Electrical Vault
.........................................................................................................................................
4-51 Aircraft Fuel
Storage
................................................................................................................................
4-51 FBO Terminal
Building.............................................................................................................................
4-53 |
|
|
|
|
|
Automobile Parking
Requirements............................................................................................................
4-54 |
|
GA
PASSENGERS AND AUTOMOBILE REQUIREMENTS...................................................................
4-55 Security
Fencing........................................................................................................................................
4-58 |
|
SUMMARY OF FACILITY REQUIREMENTS.....................................................................................
4-59 |
|
CHAPTER 5 – AIRPORT ALTERNATIVES
ANALYSIS ...................................................... 5-1 |
|
GENERAL
.....................................................................................................................................
5-1 |
|
DEVELOPMENT CONSIDERATIONS................................................................................................
5-1 City of Jacksonville
Planning and
Development.............................................................................................
5-2 Previous Master
Plan......................................................................................................................................
5-3 |
|
PREFERRED CONCEPT SUMMARY.................................................................................................
5-4 |
|
DEVELOPMENT CONCEPTS ...........................................................................................................
5-5 Runway Length
Analysis
.................................................................................................................................
5-5 Airport Elevation
Adjustment..........................................................................................................................
5-7 Temperature Adjustment
.................................................................................................................................
5-8 Pavement Conditions
......................................................................................................................................
5-8 Instrument Approach Analysis .......................................................................................................................
5-10 Air Traffic Control
.........................................................................................................................................
5-10 GA Security Requirements
.............................................................................................................................
5-10 |
|
AIRFIELD CONCEPTS ..................................................................................................................
5-11 Airfield Concept 1
(No Build/Limited Development)
.....................................................................................
5-12 Airfield
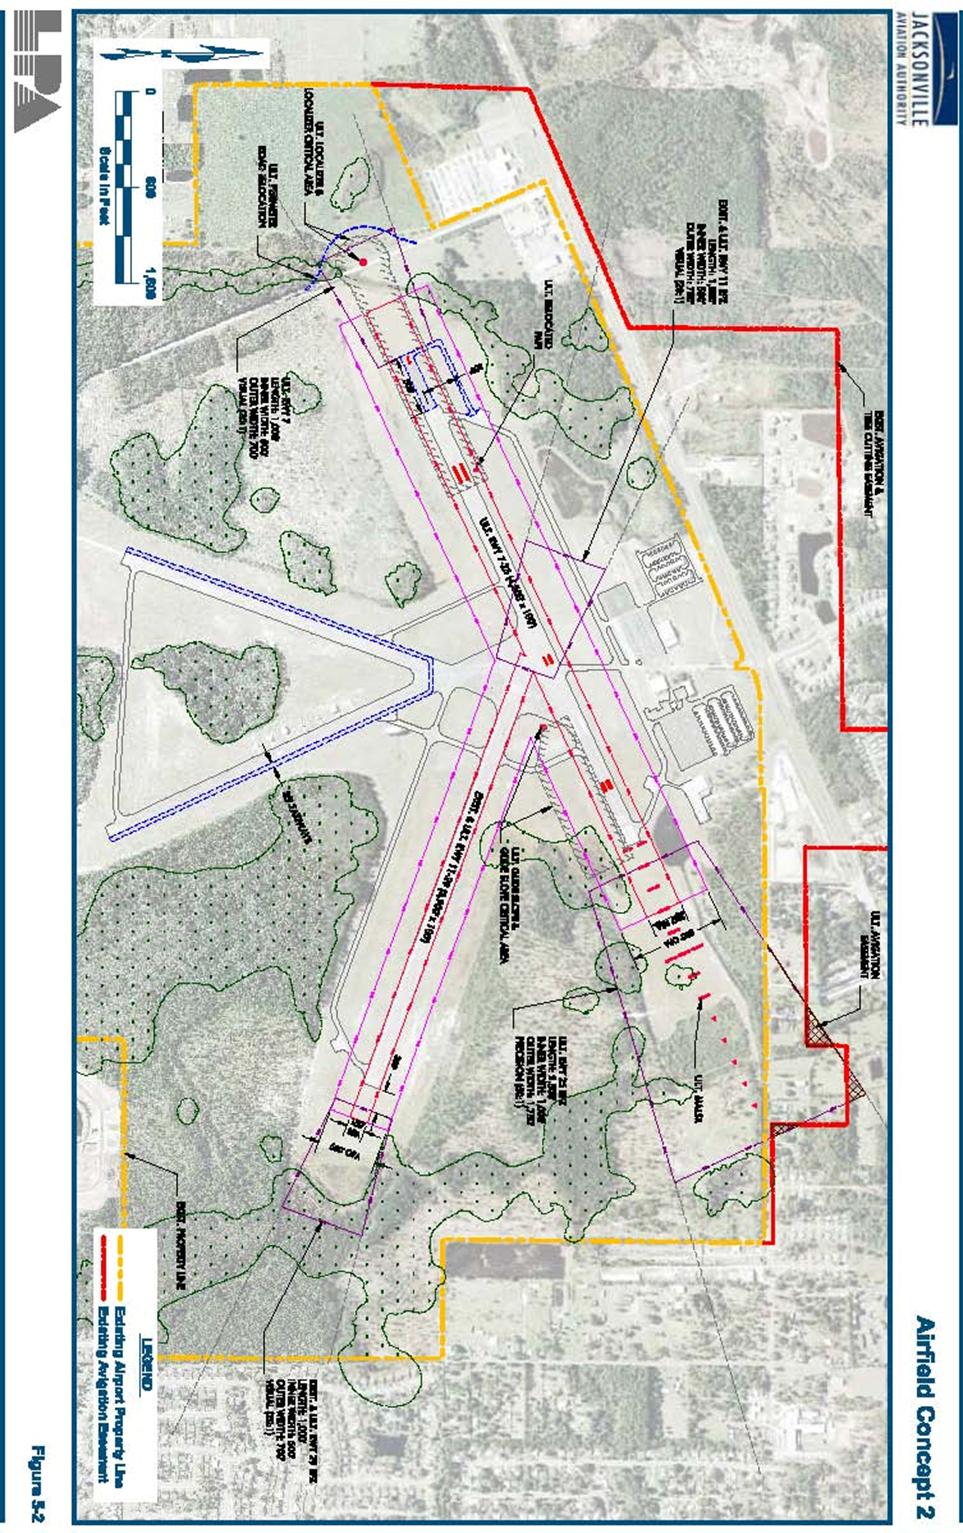
Concept 2 (Constrained Development).............................................................................................
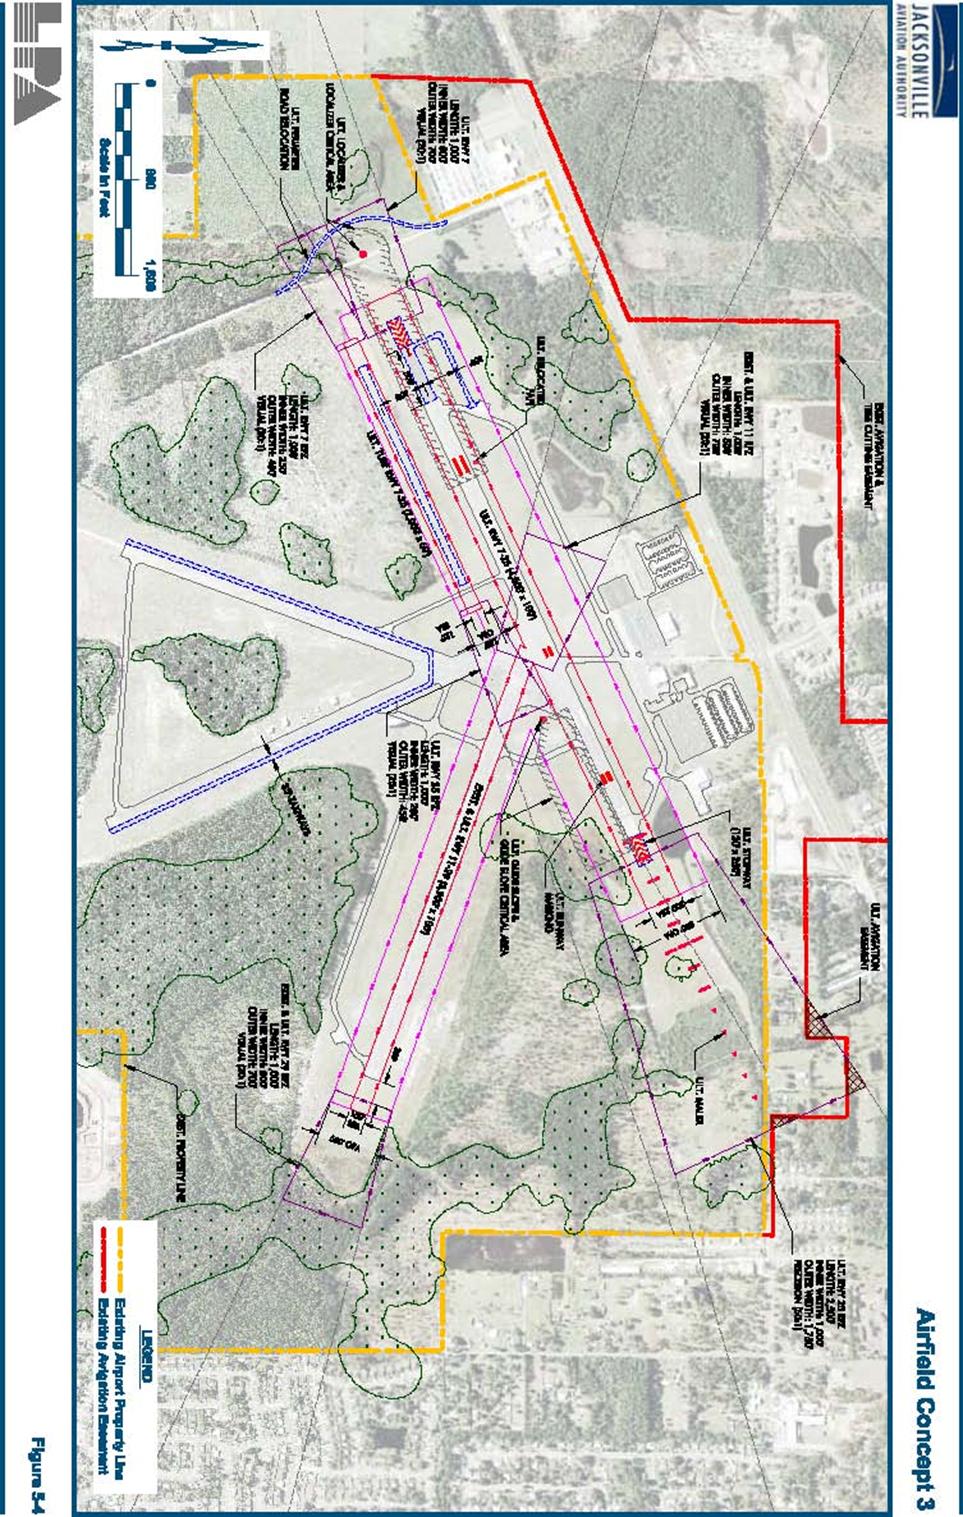
5-15 Airfield Concept 3 (Unconstrained
Development).........................................................................................
5-21 Environmental Assessment.............................................................................................................................
5-30 Evaluation of Concepts
..................................................................................................................................
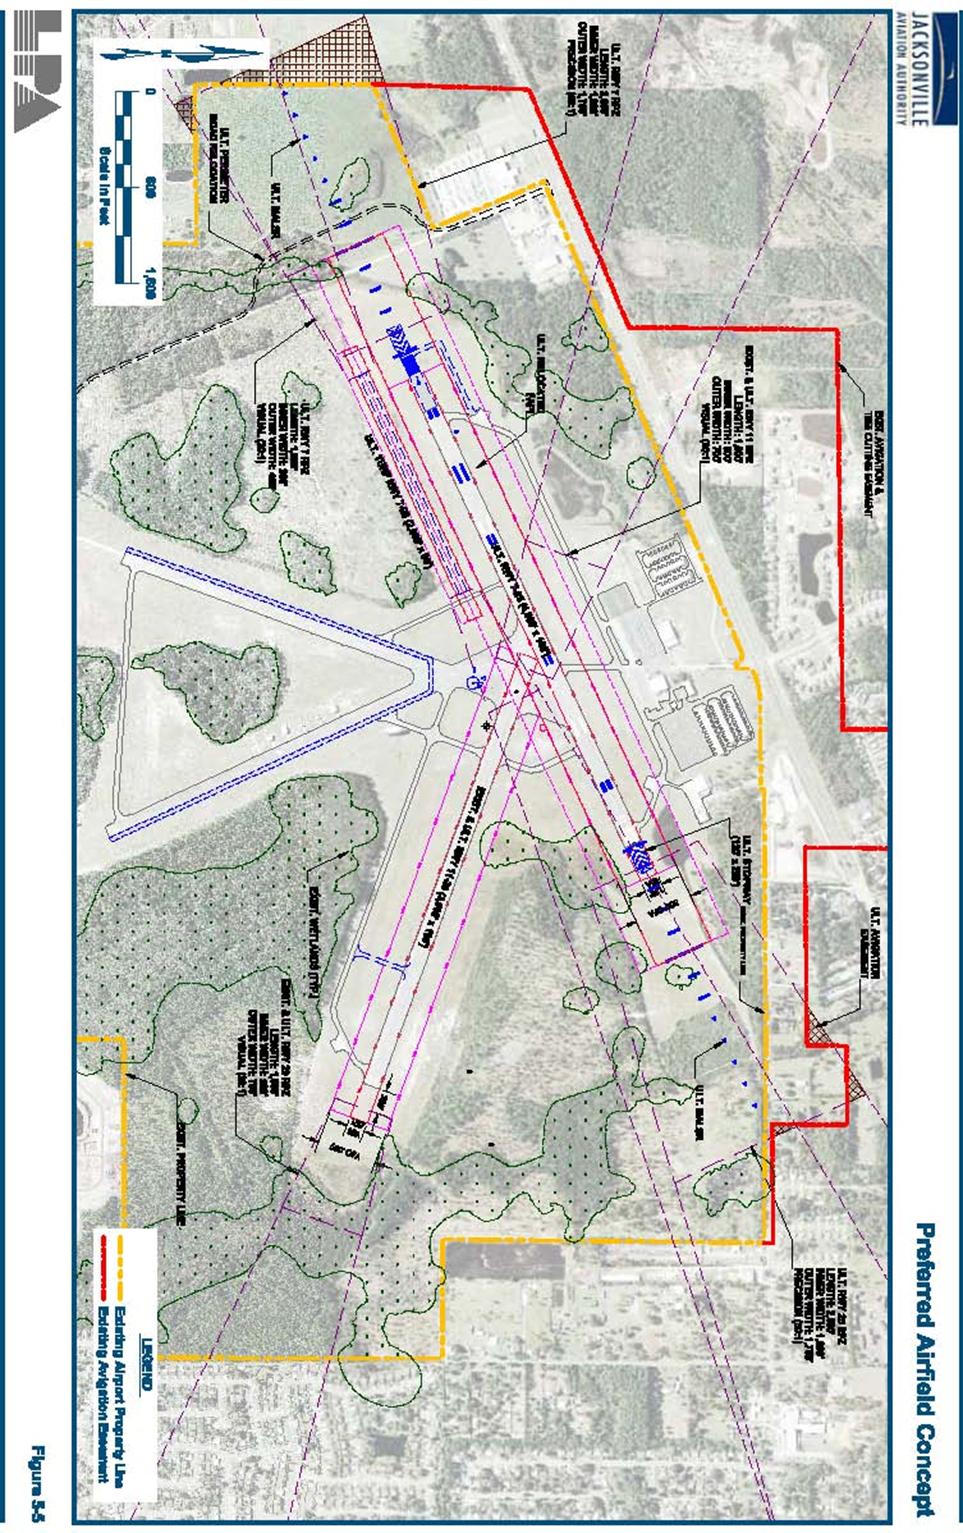
5-30 Recommended Airfield
Concept.....................................................................................................................
5-31 Land Use
........................................................................................................................................................
5-39 Airport
Operations.........................................................................................................................................
5-41 Corporate and Light General Aviation
..........................................................................................................
5-41 Airport Commerce and Industrial Park
.........................................................................................................
5-42 Residential
Development................................................................................................................................
5-43 Mixed Use
......................................................................................................................................................
5-44 Low Density Uses for Approach/Transition Zones
........................................................................................
5-46 |
|
LANDSIDE FACILITIES
– BUILDING AREAS.................................................................................
5-46 GA and Related
Aeronautical Development Areas
........................................................................................
5-49 North Landside
Development.........................................................................................................................
5-51 North Landside Concept 1
.............................................................................................................................
5-51 North Landside Concept
2..............................................................................................................................
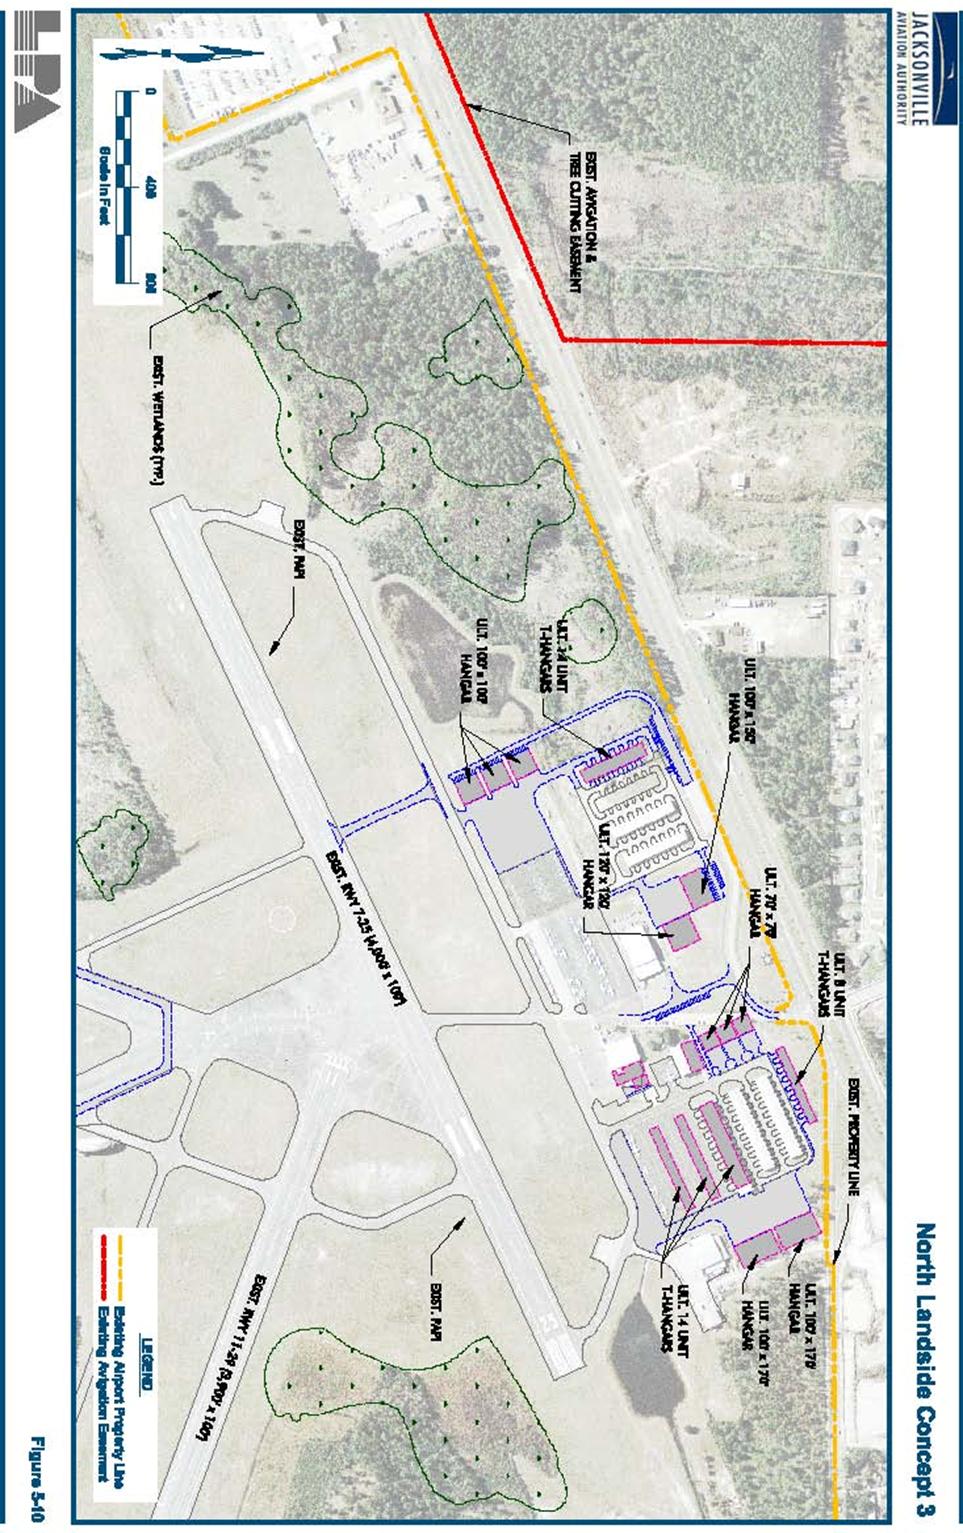
5-54 North Landside Concept 3
.............................................................................................................................
5-57 Evaluation Criteria
........................................................................................................................................
5-60 Recommended North Landside
Development.................................................................................................
5-61 Potential Environmental
Impacts...................................................................................................................
5-61 Regulatory Requirements...............................................................................................................................
5-62 State
Permit....................................................................................................................................................
5-62 City of Jacksonville Concurrency Compliance
..............................................................................................
5-62 |
|
|
|
|
|
Midfield Concept Development .....................................................................................................................
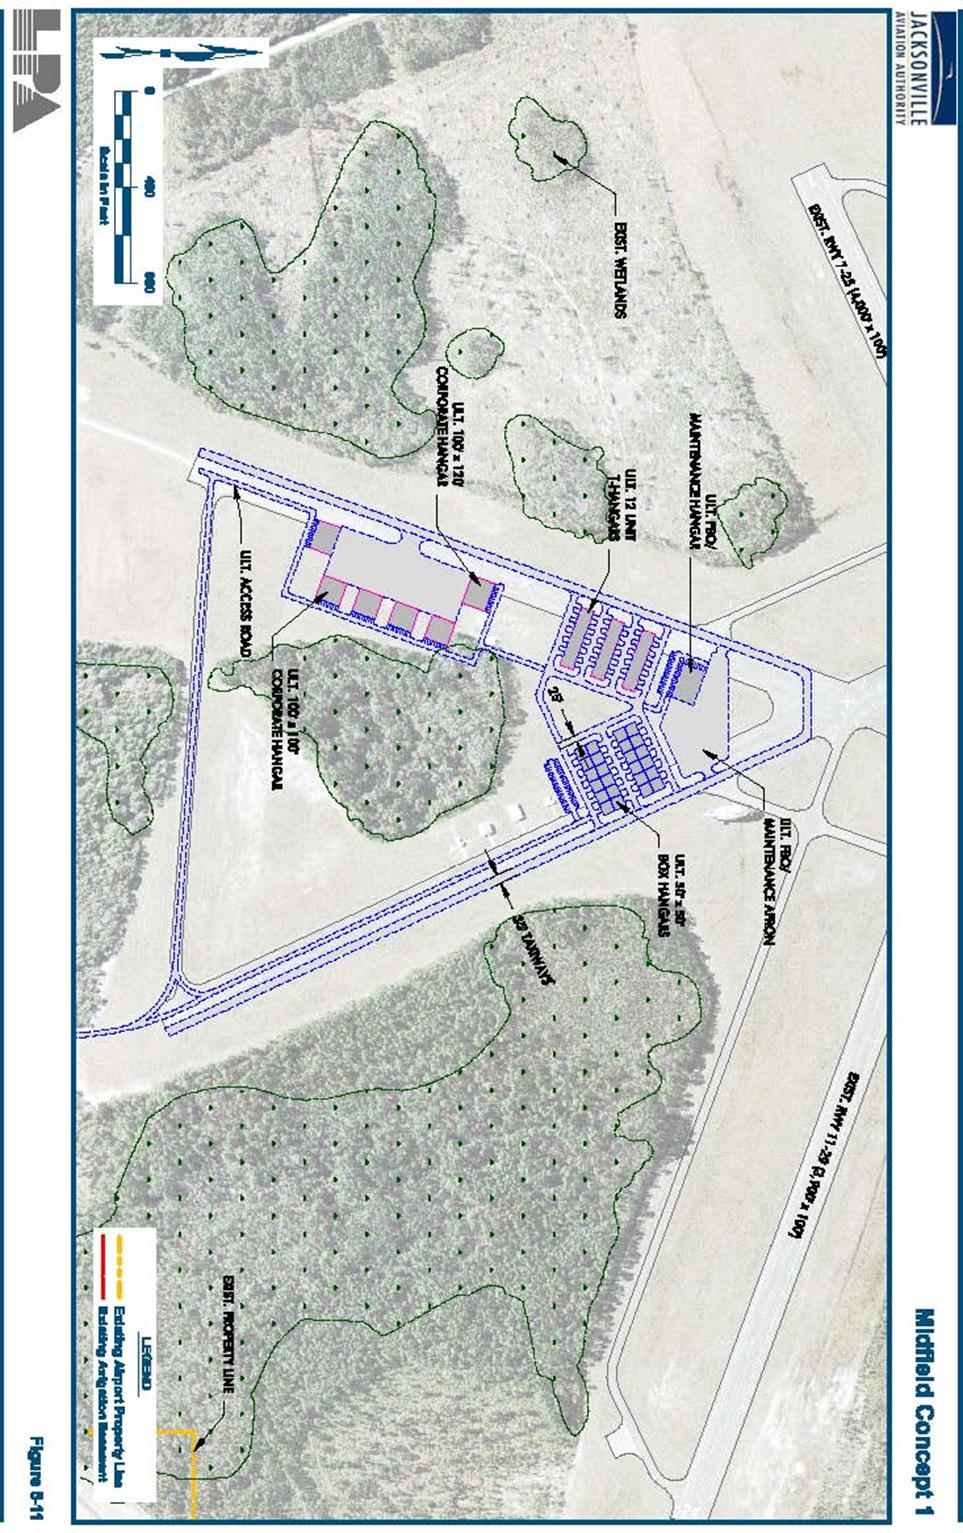
5-63 Midfield Concept
1........................................................................................................................................
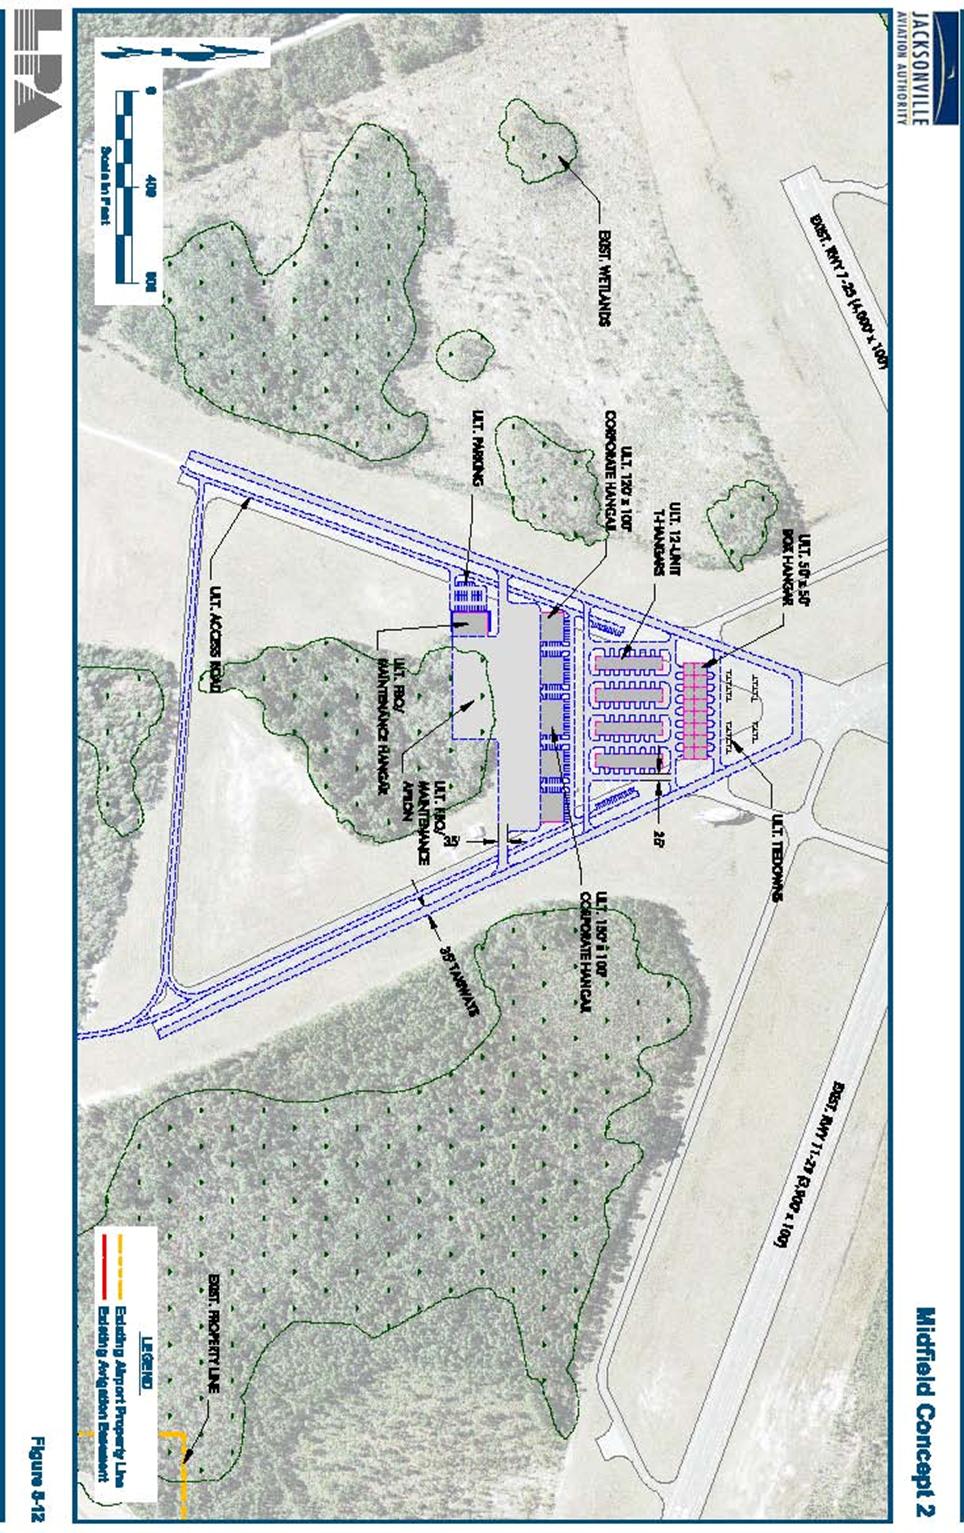
5-64 Midfield Concept 2
.......................................................................................................................................
5-67 Evaluation Criteria
........................................................................................................................................
5-72 Recommended Midfield
Development............................................................................................................
5-72 Potential Environmental Impact
....................................................................................................................
5-73 Regulatory
Requirements................................................................................................................................
5-73 State
Permit....................................................................................................................................................
5-73 City of Jacksonville Concurrency Issues........................................................................................................
5-73 Industrial/Commerce Park
Development.......................................................................................................
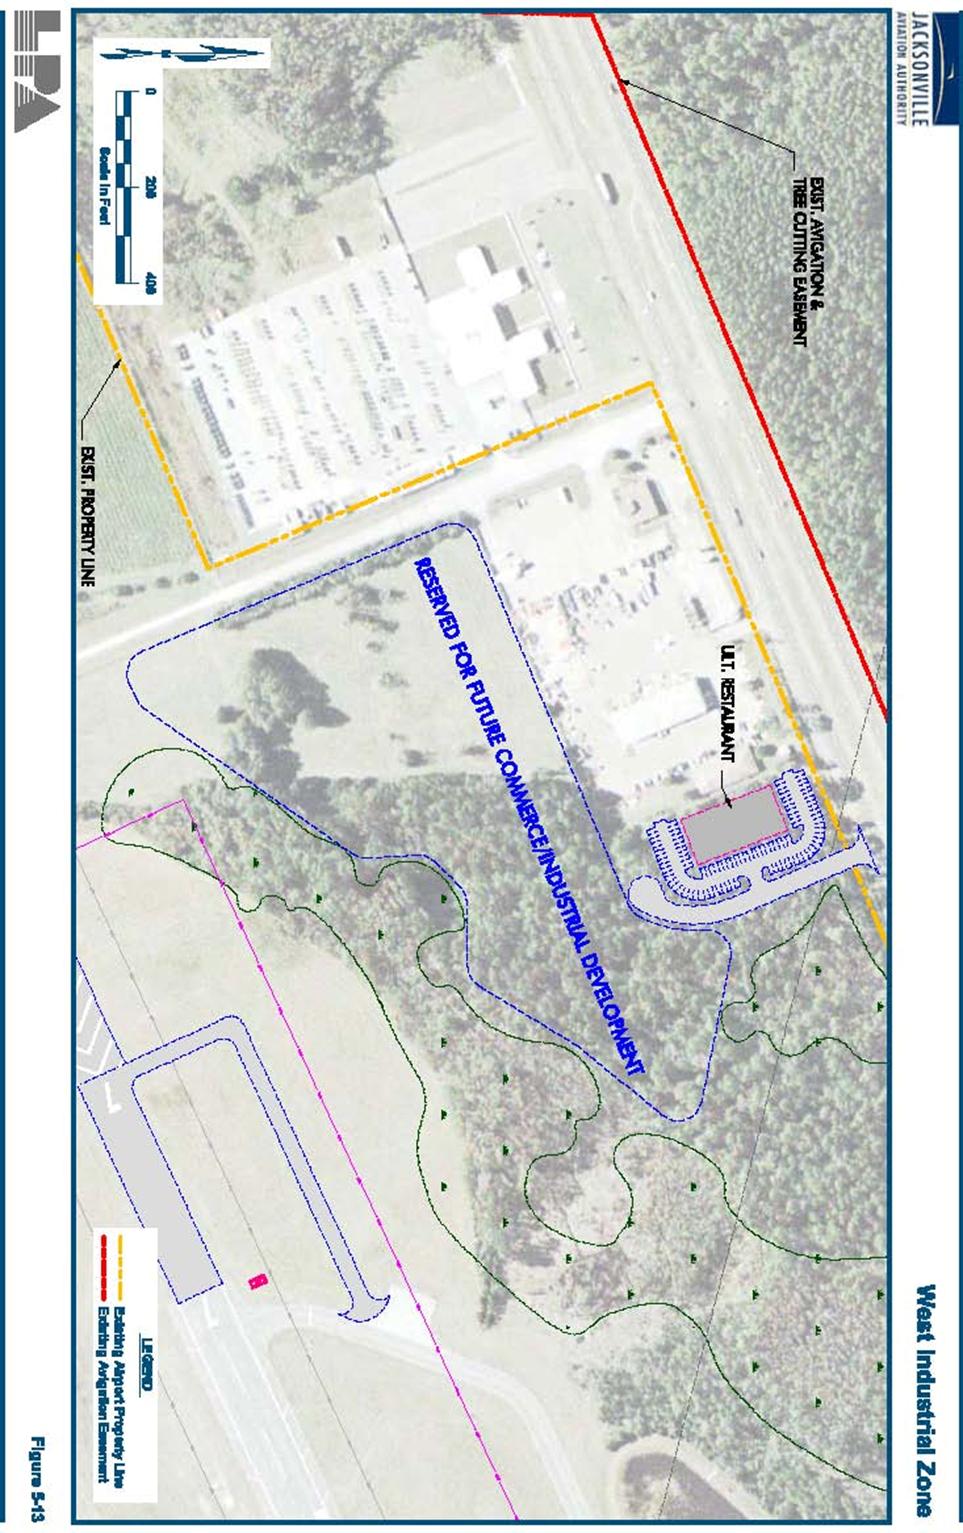
5-74 West Industrial Development..........................................................................................................................
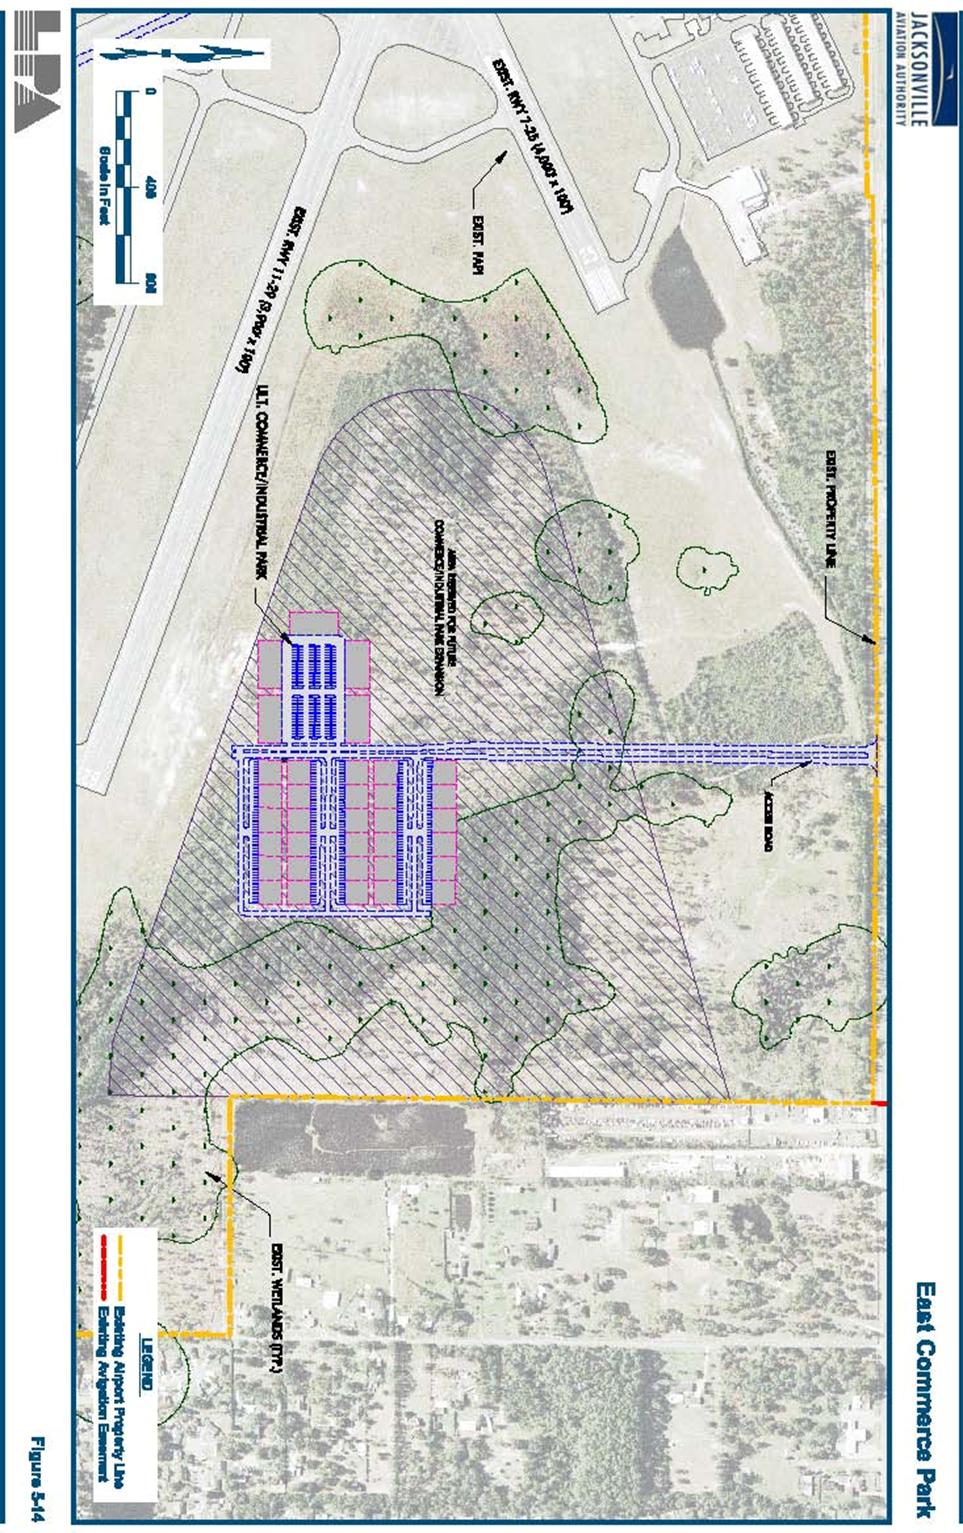
5-74 East Commerce Park
Development................................................................................................................
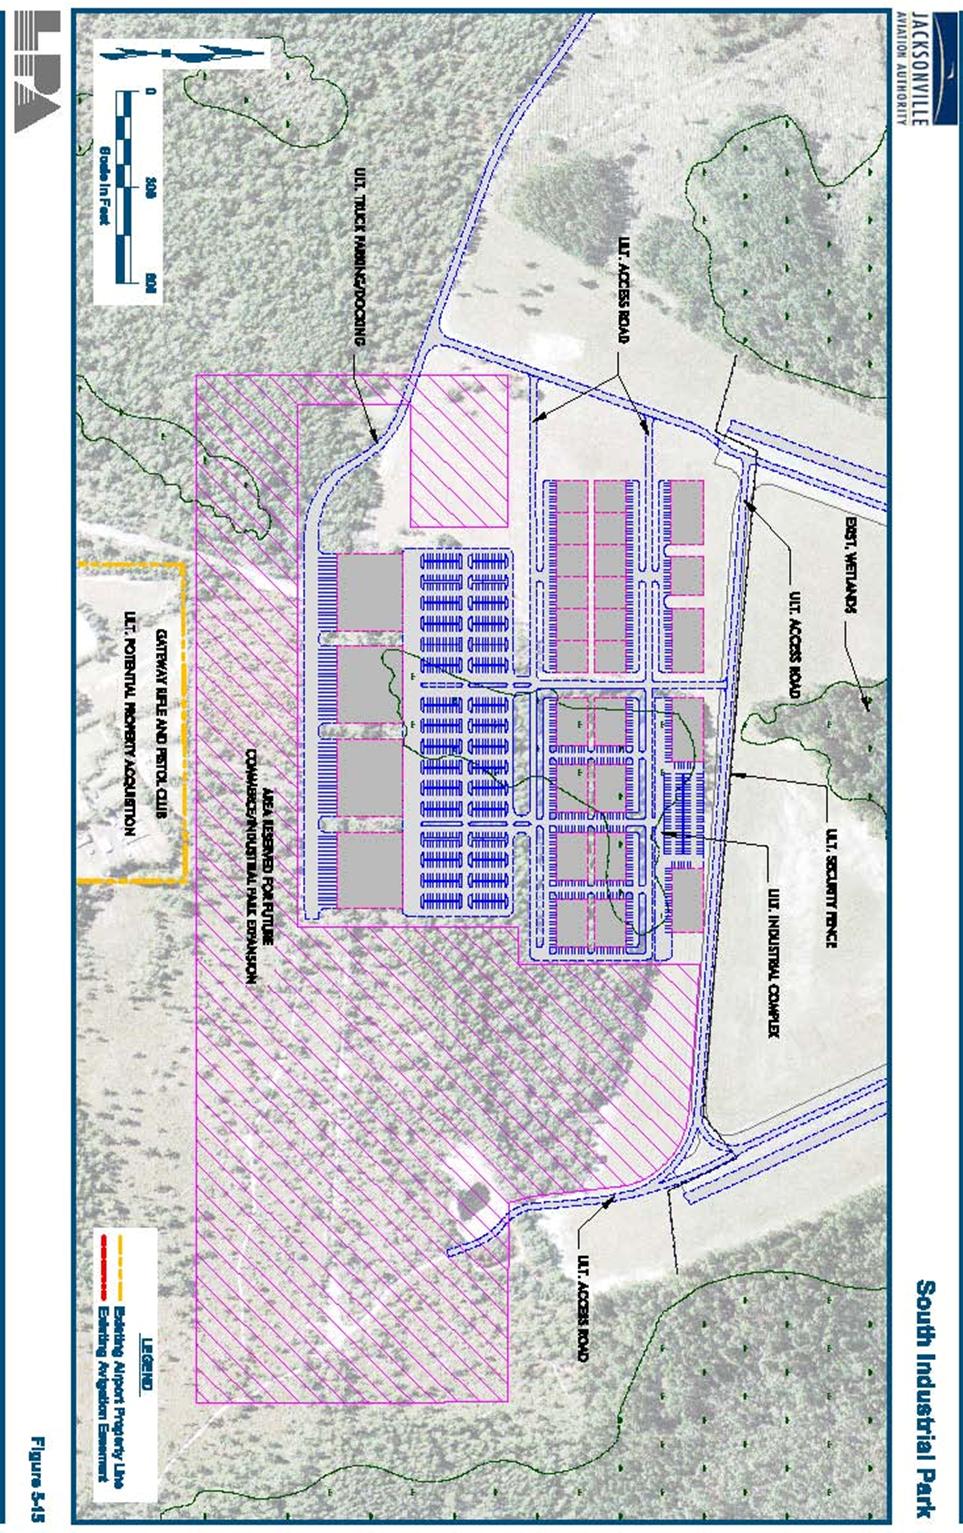
5-77 South Commerce/Industrial
Development......................................................................................................
5-79 Potential environmental Impacts
...................................................................................................................
5-83 Regulatory
Requirements................................................................................................................................
5-83 State and Federal Permits..............................................................................................................................
5-84 City of Jacksonville Concurrency
..................................................................................................................
5-84 |
|
SUPPORT FACILITIES..................................................................................................................
5-85 Roadways, Ground
Access and Signage ........................................................................................................
5-85 Airport
Maintenance
Hangar.........................................................................................................................
5-85 Security and Fencing ......................................................................................................................................
5-85 Fuel Storage
...................................................................................................................................................
5-85 Electrical Vault
..............................................................................................................................................
5-85 Air Traffic Control Tower ..............................................................................................................................
5-86 |
|
CONCLUSIONS............................................................................................................................
5-86 |
|
CHAPTER
6 – AIRPORT LAYOUT PLAN
.............................................................................
6-1 COVER SHEET ..............................................................................................................................
6-2 AIRPORT LAYOUT DRAWING ........................................................................................................6-2
GENERAL AVIATION TERMINAL AREA DRAWING ........................................................................
6-3 INNER APPROACH ZONE PROFILES...............................................................................................
6-3 AIRPORT AIRSPACE DRAWING .....................................................................................................
6-3 AIRPORT LAND USE DRAWING ....................................................................................................
6-4 AIRPORT PROPERTY MAP.............................................................................................................
6-5 SUMMARY....................................................................................................................................
6-5 |
|
CHAPTER 7 – IMPLEMENTATION AND CAPITAL
IMPROVEMENT PLAN .................. 7-1 GENERAL ....................................................................................................................................
7-1 FUNDING SOURCES ......................................................................................................................
7-2 Federal Funding
............................................................................................................................................. 7-2 State
Funding..................................................................................................................................................
7-3 Local (Sponsor) Funding
................................................................................................................................
7-8 Other Funding Sources
...................................................................................................................................
7-9 |
|
|
|
|
|
Third Party/Private Development .................................................................................................................. 7-10 FINANCIAL
FEASIBILITY.............................................................................................................
7-10 |
|
Capital Improvement Plan
............................................................................................................................. 7-10 |
|
Program Phasing and Cost Estimates
...........................................................................................................
7-10 |
|
Short-Term
Developments..............................................................................................................................
7-11 |
|
Intermediate-Term
Developments..................................................................................................................
7-12 |
|
Long-Term Developments
..............................................................................................................................
7-12 |
|
CIP Summary
................................................................................................................................................. 7-26 CASH FLOW ANALYSIS ..............................................................................................................
7-32 |
|
Projected Operating Revenues and
Expenses
................................................................................................ 7-33 |
|
Cash Flow Assessment
...................................................................................................................................
7-37 CONCLUSIONS............................................................................................................................
7-43 |
|
APPENDICES
APPENDIX A – GLOSSARY OF TERMS
..............................................................................
A-1 APPENDIX B -FAA/FDOT AND RELATED DATA ............................................................
B-1 APPENDIX C – REGIONAL GUIDANCE
LETTER............................................................... C-1
APPENDIX D – AIRCRAFT NOISE
ANALYSIS...................................................................
D-1 APPENDIX E – PRELIMINARY ESTIMATES OF PROJECT COSTS
................................. E-1 APPENDIX F -PUBLIC INVOLVEMENT AND
RUNWAY EXTENSION LETTERS........F-1 APPENDIX G -FAA PROJECT PRIORITY FUNDING
........................................................ G-1 APPENDIX H -
FLORIDA PUBLIC
LAW...............................................................................H-1
APPENDIX I - HERLONG AIRPORT TITLE SEARCH
INFORMATION..............................I-1 |
|
|
|
|

|
|
|
|

|
TABLE 3-12
FORECAST ANNUAL GENERAL AVIATION AIRCRAFT OPERATIONS...................3-22
TABLE 3-13 HISTORIC AND FORECAST MILITARY OPERATIONS
................................................3-24 TABLE 3-14 LOCAL VS.
ITINERANT OPERATIONS
.............................................................................3-25
TABLE 3-15 PROJECTED ANNUAL INSTRUMENT OPERATIONS
....................................................3-26 TABLE 3-16 FORECAST
PEAK GENERAL AVIATION ACTIVITY
ONLY.........................................3-27 TABLE 3-17 COMPARISON OF
TAF AND AIRPORT OPERATIONS FORECAST............................3-28 TABLE
3-18 AIRPORT PLANNING FORECASTS FORECAST LEVELS AND GROWTH RATES .3-29 TABLE
4-1 AIRCRAFT APPROACH CATEGORIES
.............................................................................
4-3 TABLE 4-2 AIRCRAFT DESIGN
GROUPS...............................................................................................
4-3 TABLE 4-3 EXIT TAXIWAY LOCATIONS
.............................................................................................
4-11 TABLE 4-4 FAA AIRCRAFT
CLASSIFICATIONS.................................................................................
4-12 TABLE 4-5 RUNWAY END
UTILIZATION.............................................................................................
4-14 TABLE 4-6 CALCULATION OF HOURLY
CAPACITY........................................................................
4-15 TABLE 4-7 HOURLY CAPACITY OF RUNWAY COMPONENT CALCULATION MATRIX........
4-17 TABLE 4-8 ANNUAL AIRFIELD CAPACITY
.........................................................................................
4-18 TABLE 4-9 GA DAILY OPPORTUNITY COSTS ....................................................................................
4-21 TABLE 4-10 SUMMARY OF AIRFIELD CAPACITY ANALYSIS
......................................................... 4-24 TABLE 4-11
WIND COVERAGE PERCENTAGES ..................................................................................
4-28 TABLE 4-12 BASED AIRCRAFT DEMAND
..............................................................................................
4-38 TABLE 4-13 FORECAST PERCENT OF BASED AIRCRAFT DEMAND
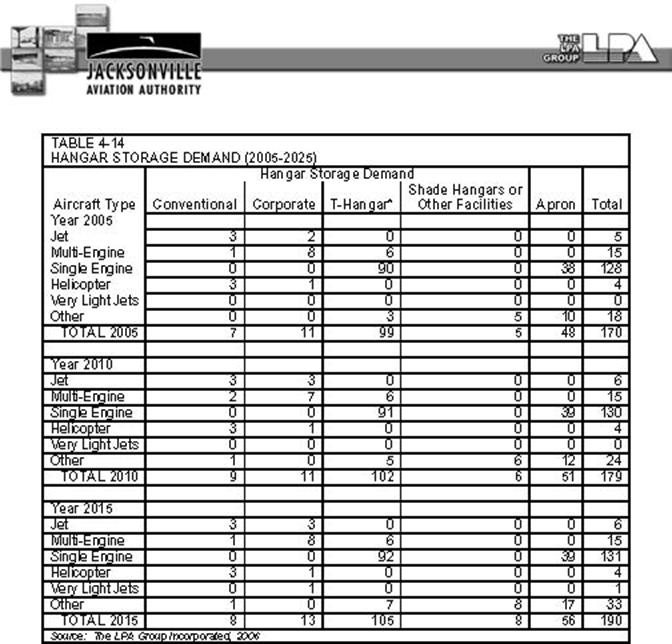
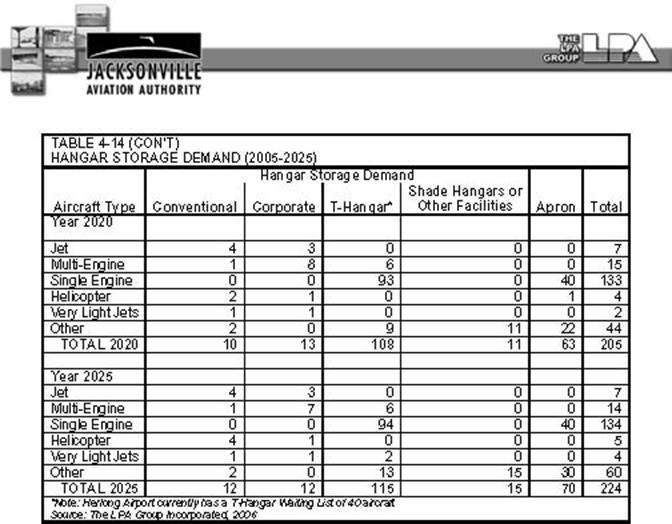
............................................. 4-39 TABLE 4-14 HANGAR STORAGE
DEMAND
(2005-2025).......................................................................
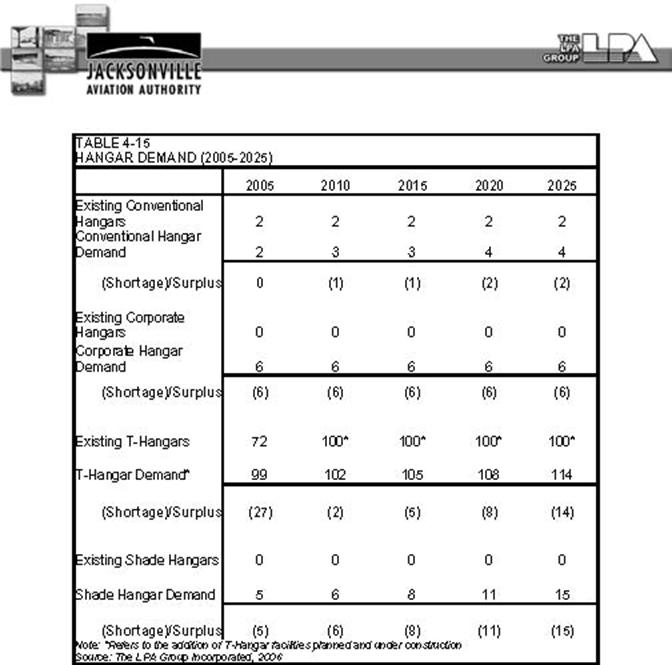
4-40 TABLE 4-15 HANGAR DEMAND
(2005-2025) ............................................................................................4-42
TABLE 4-16 CONVENTIONAL AND CORPORATE HANGAR APRON REQUIREMENTS (BASED |
|
|
|
|

|
|
|
|

|
|
|
|

|
|
|
|
|
|
|
|
|
FIGURE 1-1 STEPS IN THE MASTER PLANNING
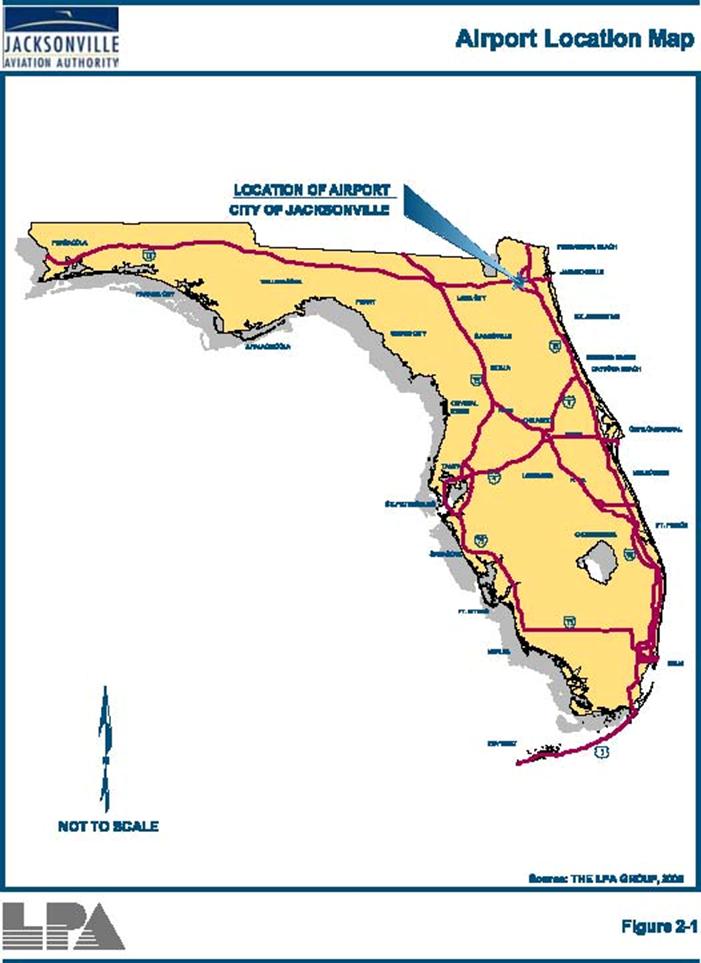
PROCESS................................................ 1-14 FIGURE 2-1
AIRPORT LOCATION MAP
.....................................................................................
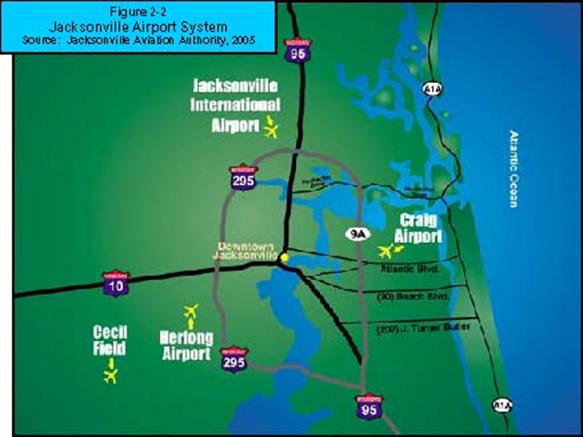
2-3 FIGURE 2-2 JACKSONVILLE AIRPORT SYSTEM
.................................................................... 2-4
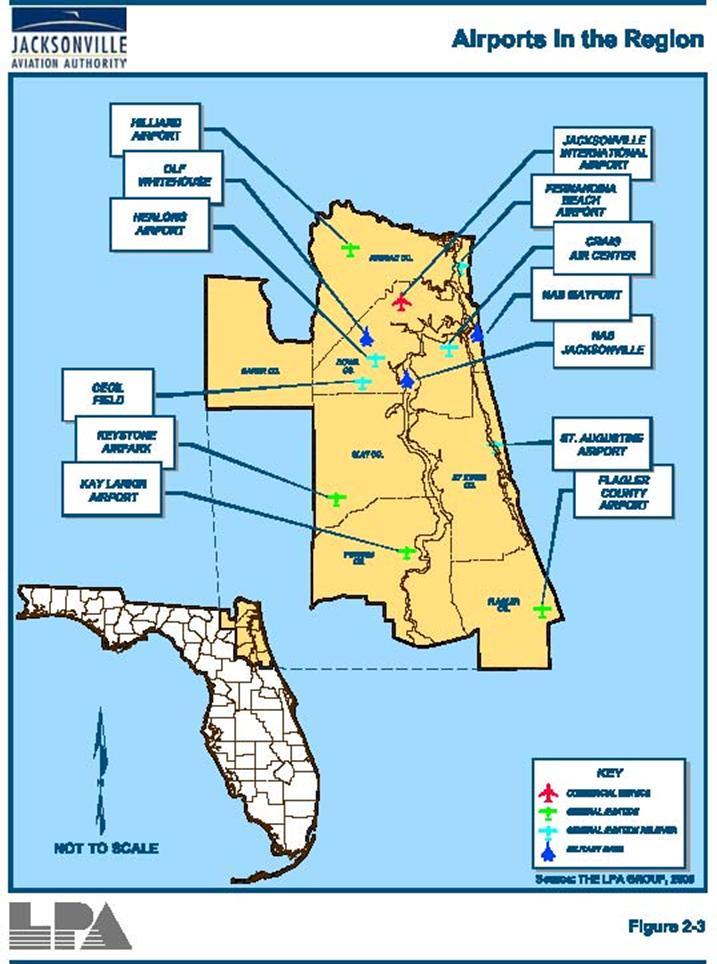
FIGURE 2-3 AIRPORTS IN THE
REGION....................................................................................
2-6 FIGURE 2-4 ALL WEATHER WIND ROSE
..................................................................................
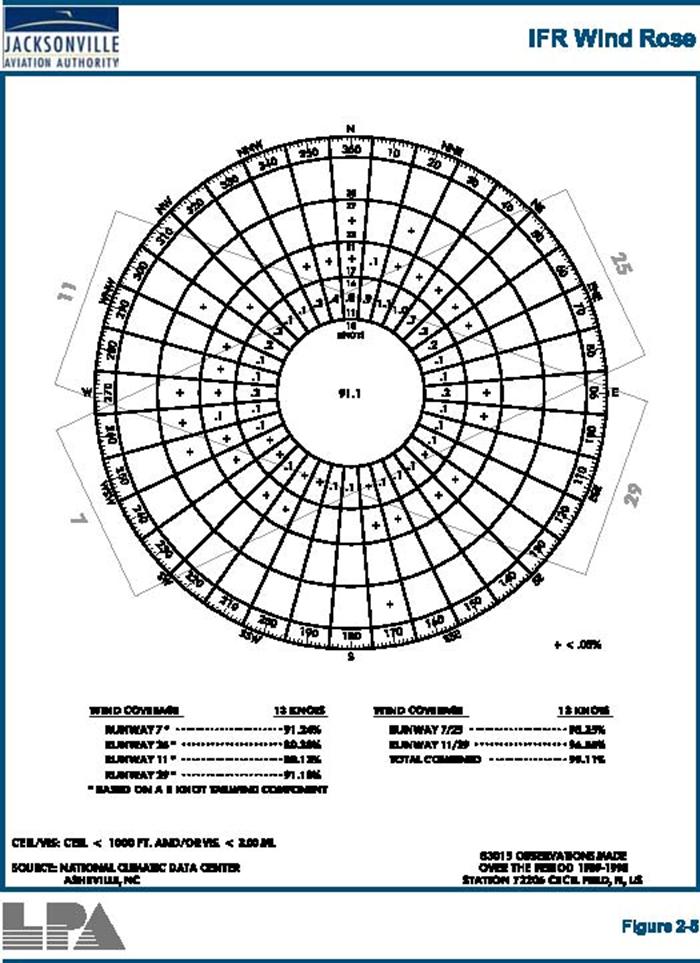
2-9 FIGURE 2-5 IFR WIND ROSE
........................................................................................................2-10
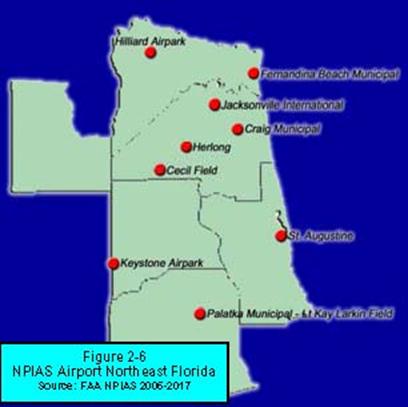
FIGURE 2-6 NPIAS AIRPORTS NORTHEAST FLORIDA
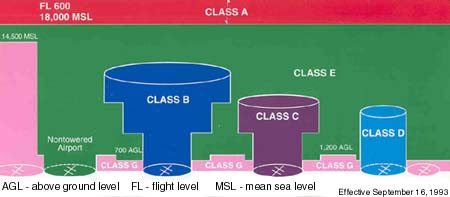
....................................................... 2-15 FIGURE 2-7
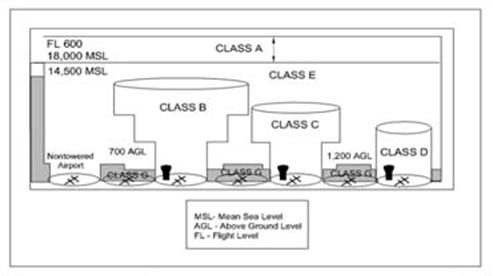
AIRSPACE CLASSES
...............................................................................................
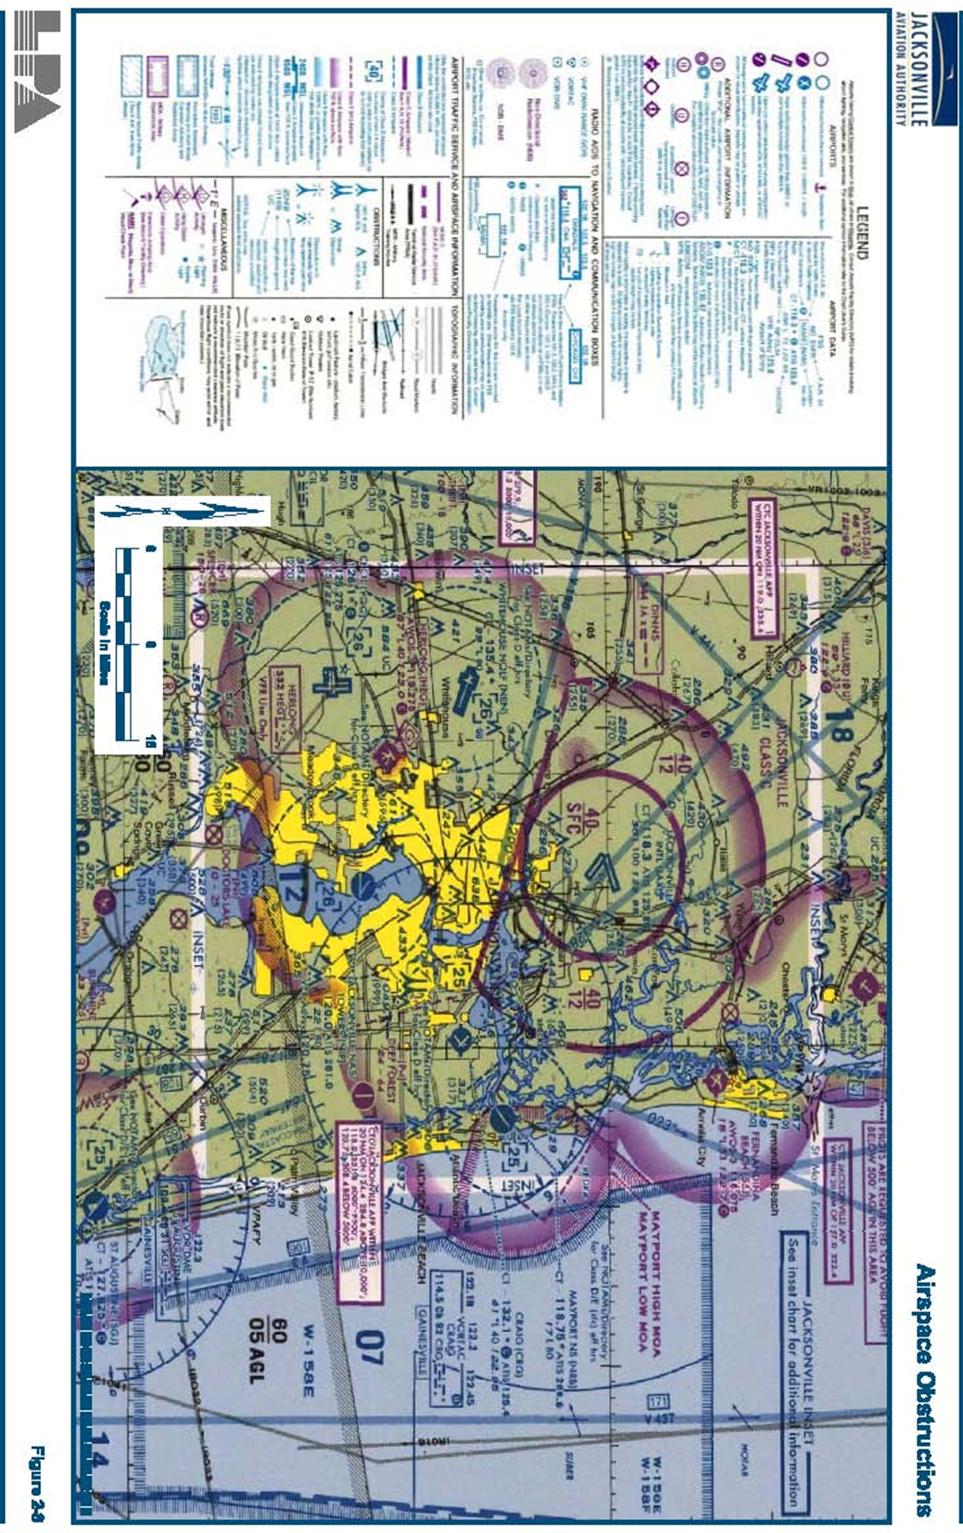
2-16 FIGURE 2-8 AIRSPACE OBSTRUCTIONS .................................................................................
2-17 FIGURE 2-9 APPROACH AND DEPARTURE PATTERNS FOR RUNWAYS 7 &
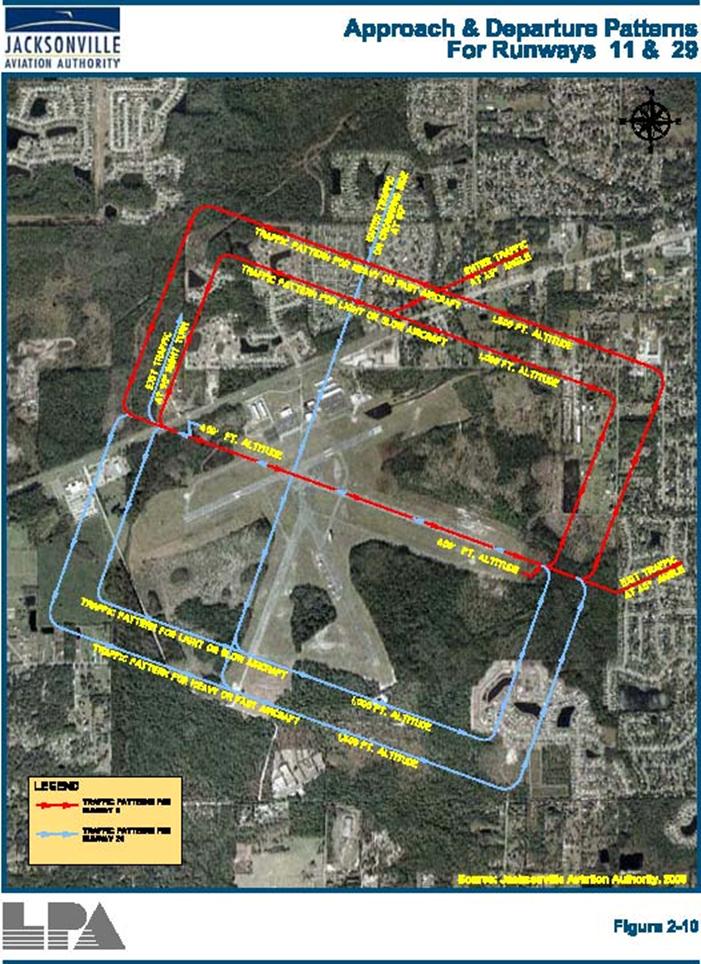
25............2-19 FIGURE 2-10 APPROACH AND DEPARTURE PATTERNS FOR RUNWAYS 11
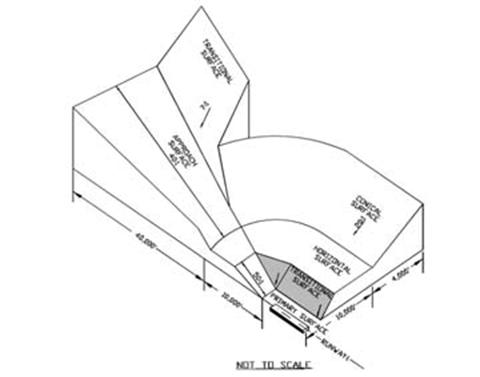
& 29..........2-20 FIGURE 2-11 TYPICAL PART 77
SURFACES..............................................................................
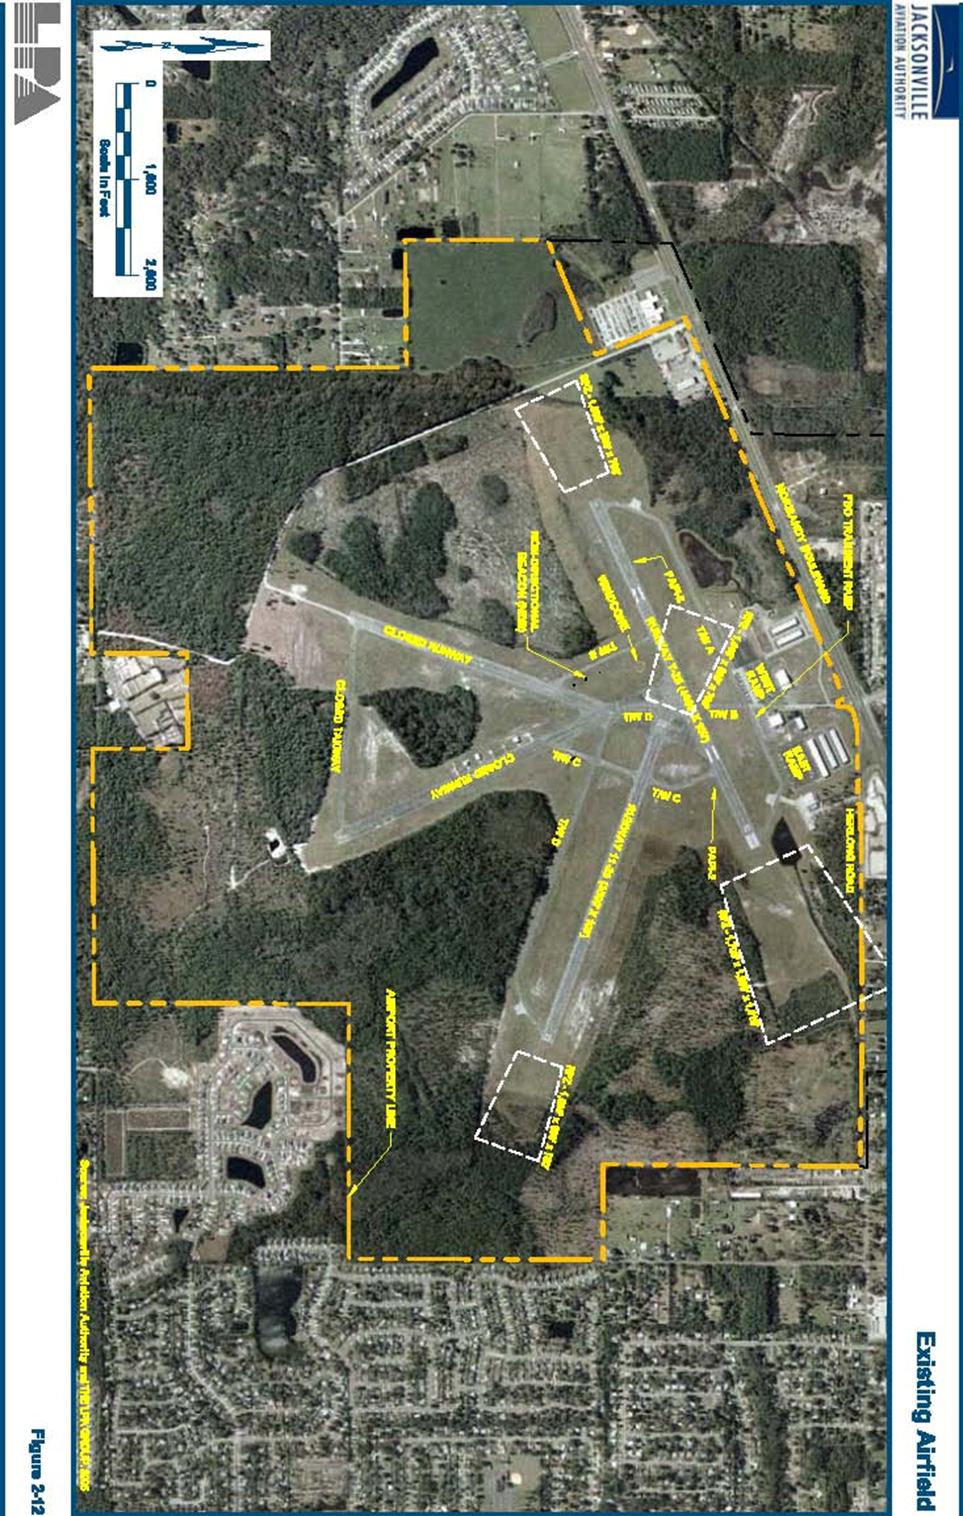
2-22 FIGURE 2-12 EXISTING AIRFIELD
..............................................................................................
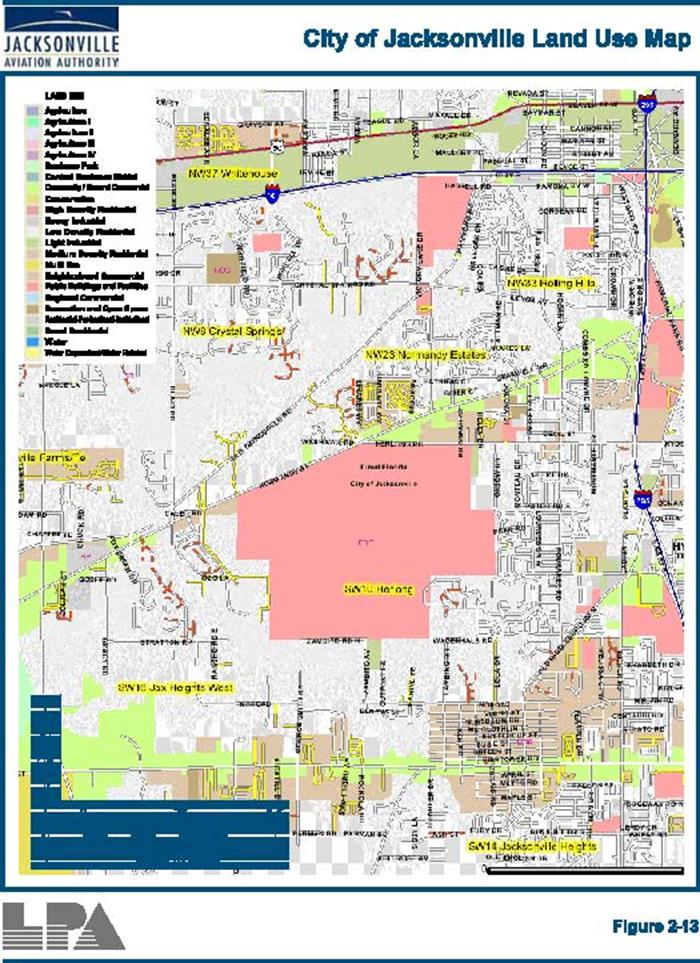
2-24 FIGURE 2-13 CITY OF JACKSONVILLE LAND USE MAP
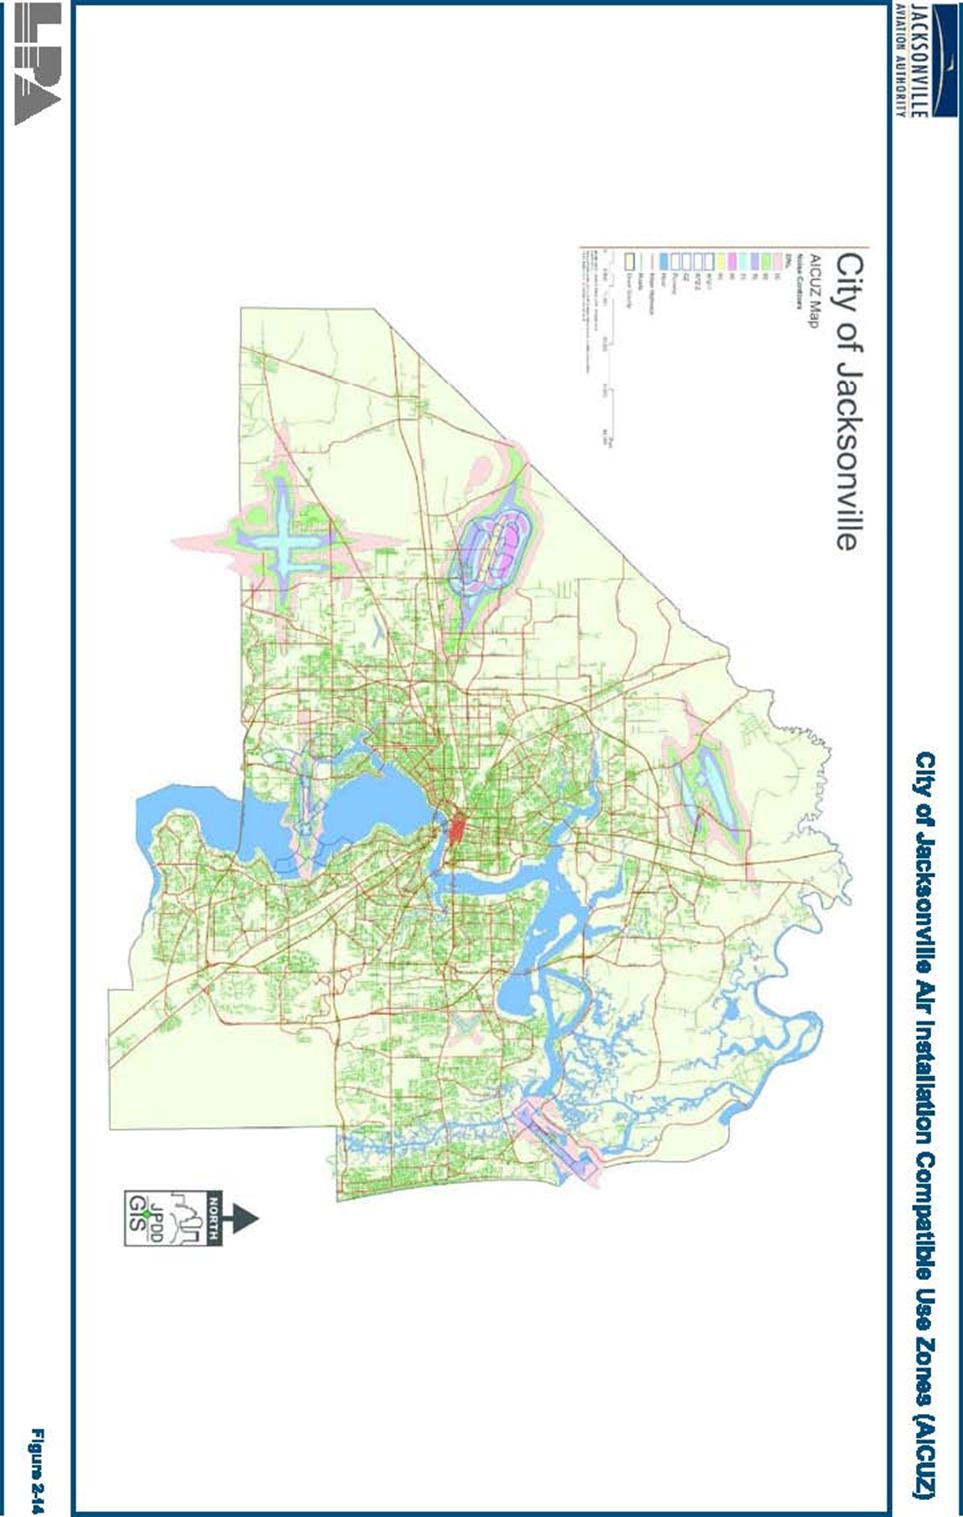
...................................................... 2-31 FIGURE 2-14 CITY
OF JACKSONVILLE AIR INSTALLATION COMPATIBLE USE ZONES |
|
(AICUZ).......................................................................................................................
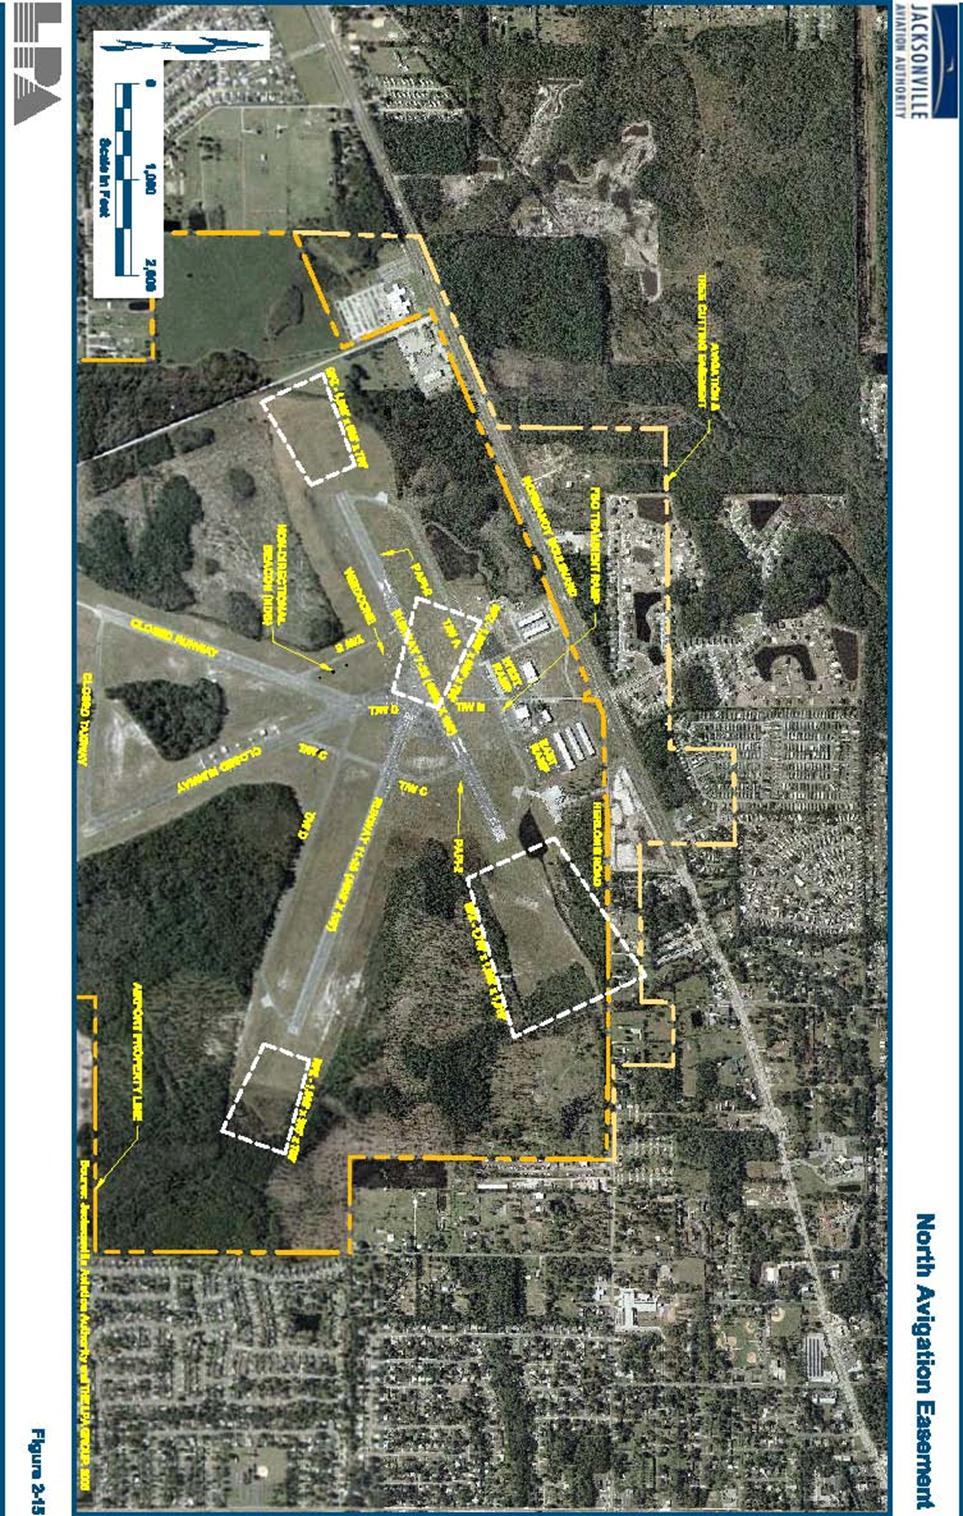
2-32 FIGURE 2-15 NORTH AVIGATION
EASEMENT........................................................................
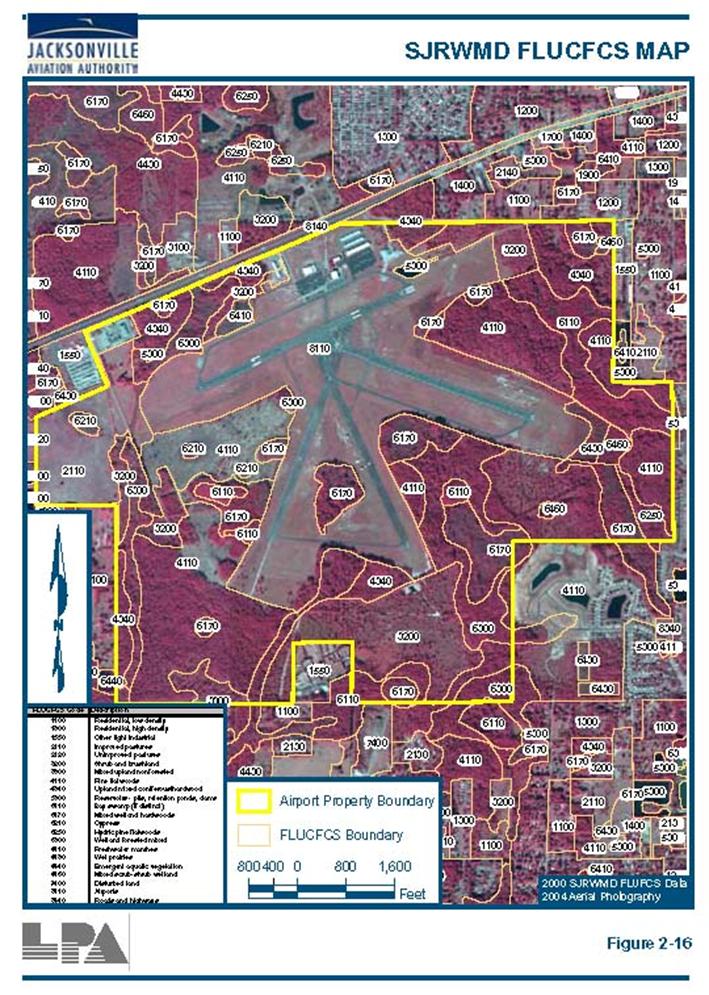
2-33 FIGURE 2-16 SJRWMD FLUCFCS MAP
.......................................................................................
2-42 |
|
|
|
|
|
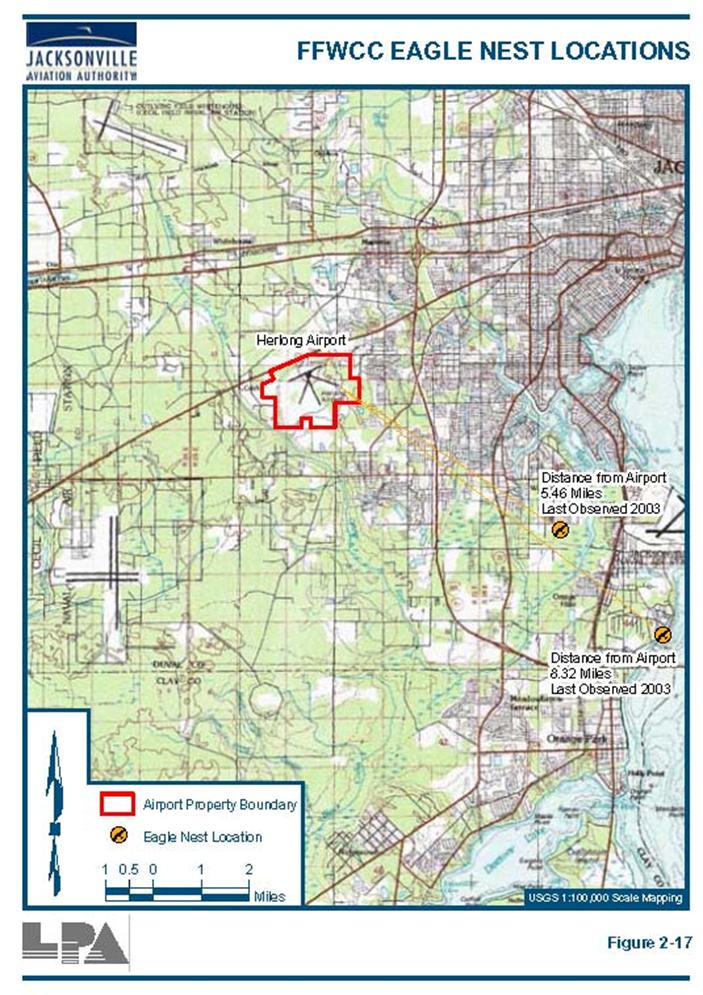
FIGURE
2-17 FFWCC EAGLE NEST LOCATIONS
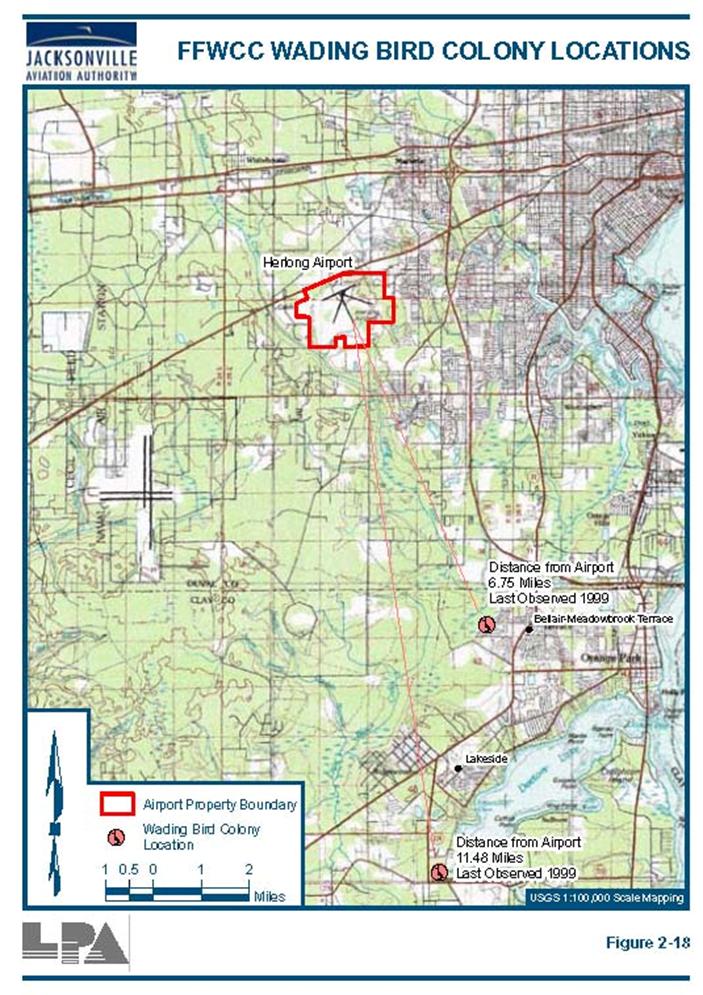
.................................................................... 2-45 FIGURE
2-18 FFWCC WADING BIRD COLONY LOCATIONS
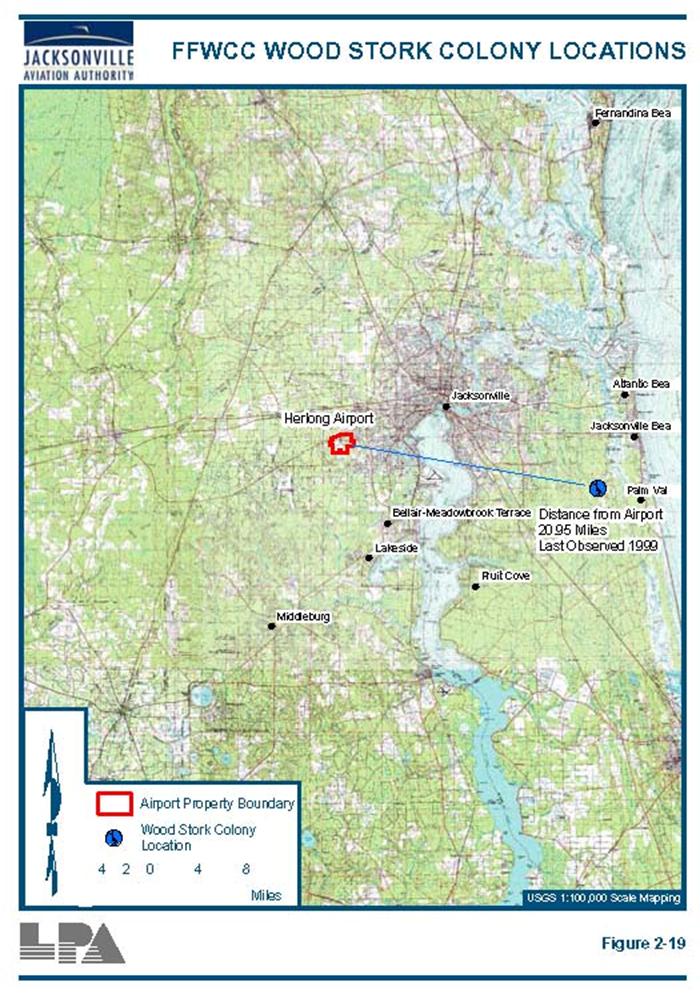
............................................... 2-46 FIGURE 2-19 FFWCC WOOD
STORK COLONY LOCATIONS ............................................... 2-47
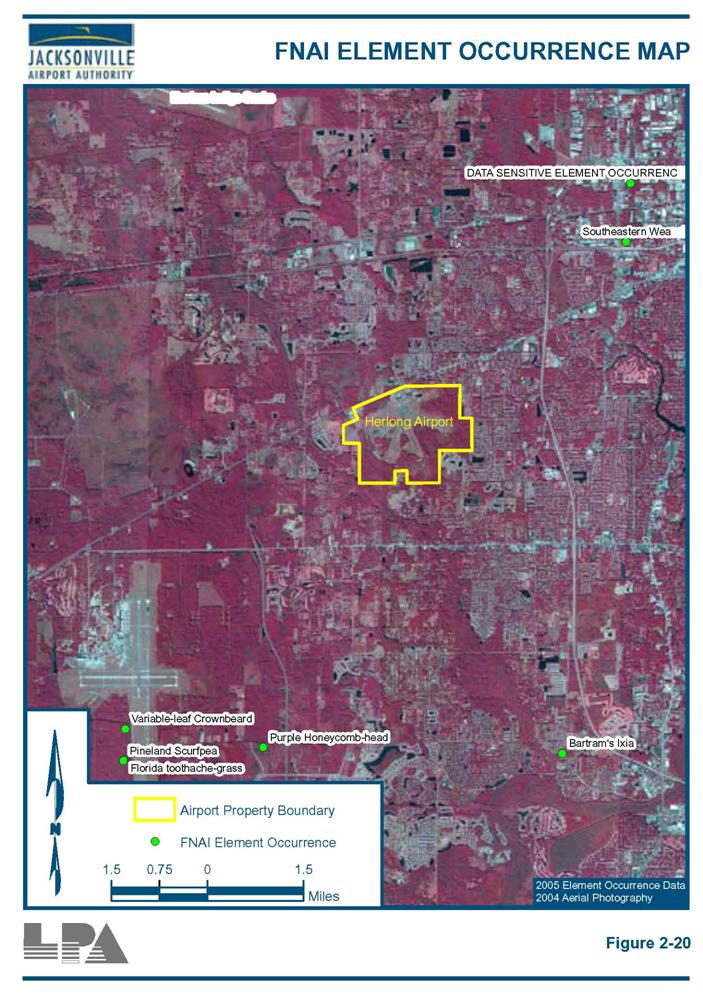
FIGURE 2-20 FNAI ELEMENT OCCURRENCE MAP ................................................................
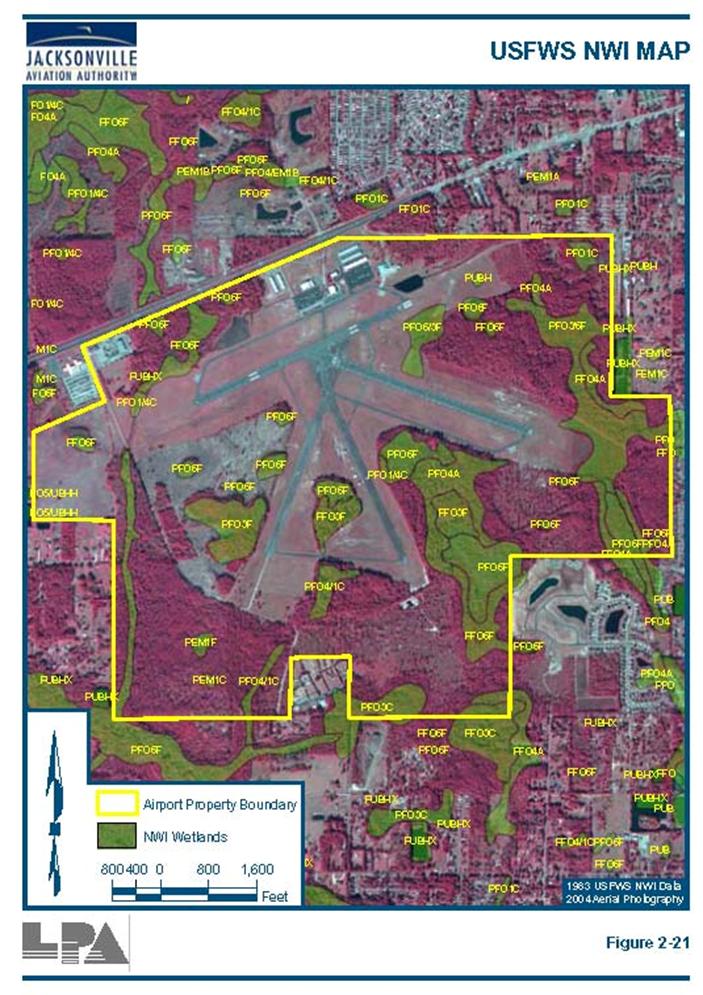
2-48 FIGURE 2-21 USFWS NWI MAP
.....................................................................................................
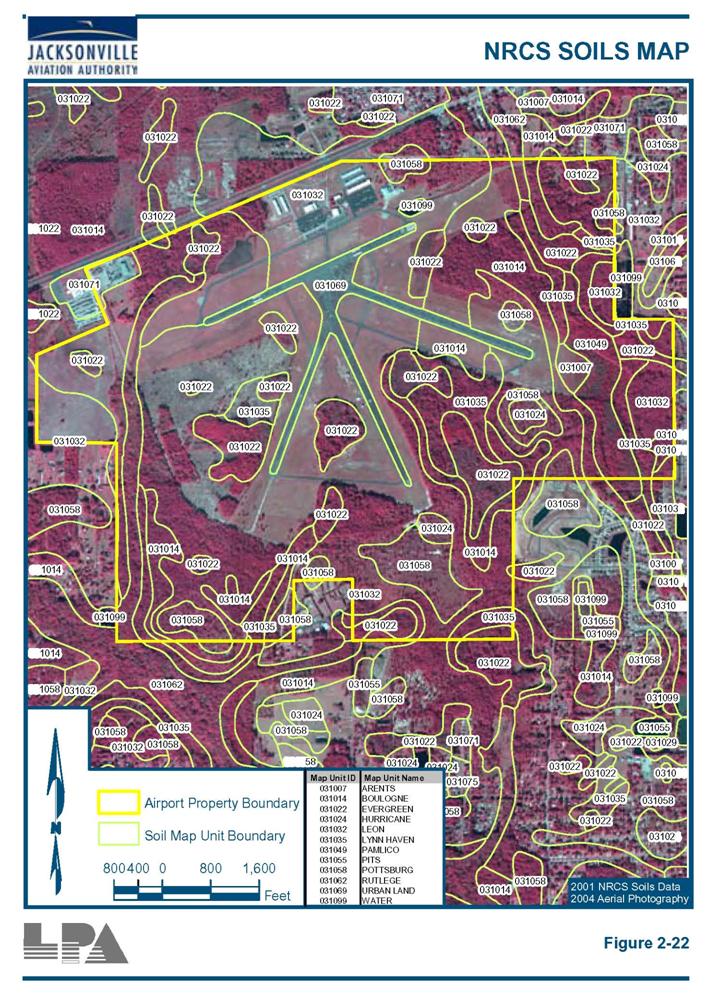
2-52 FIGURE 2-22 NRCS SOILS MAP.....................................................................................................
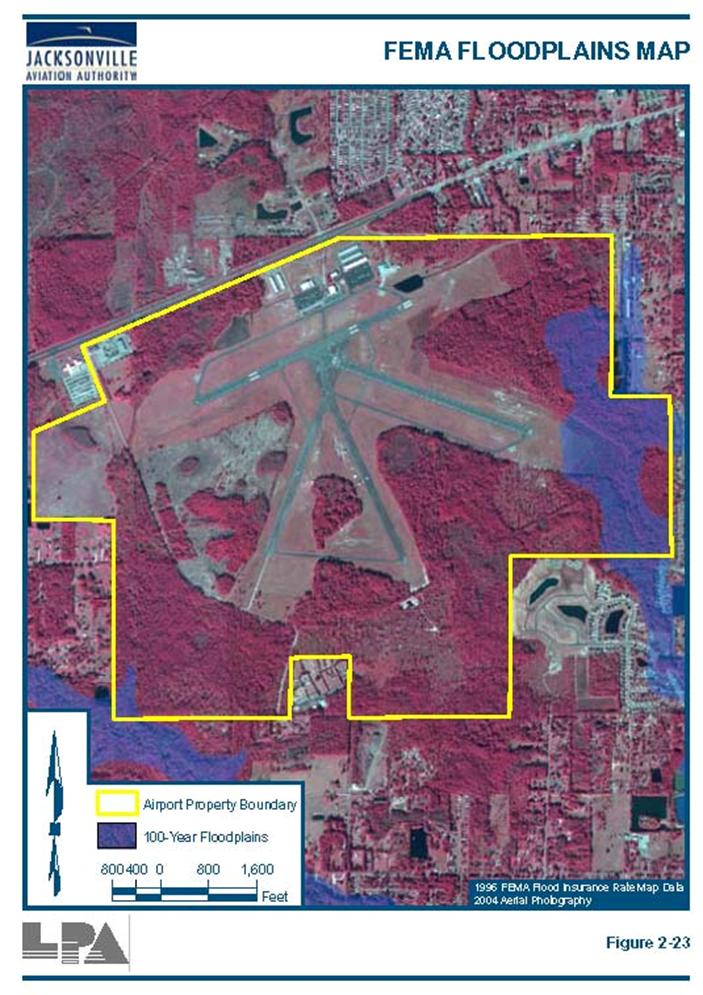
2-53 FIGURE 2-23 FEMA FLOODPLAINS
MAP...................................................................................
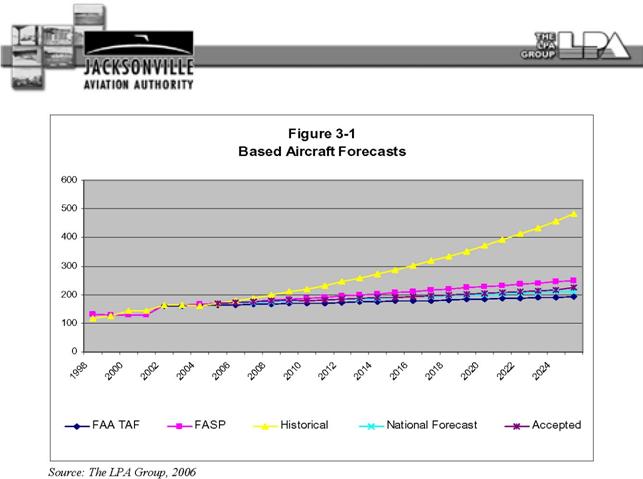
2-55 FIGURE 3-1 BASED AIRCRAFT FORECASTS ..........................................................................
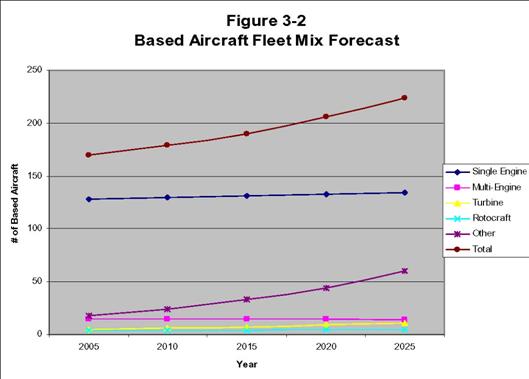
3-16 FIGURE 3-2 BASED AIRCRAFT FLEET MIX
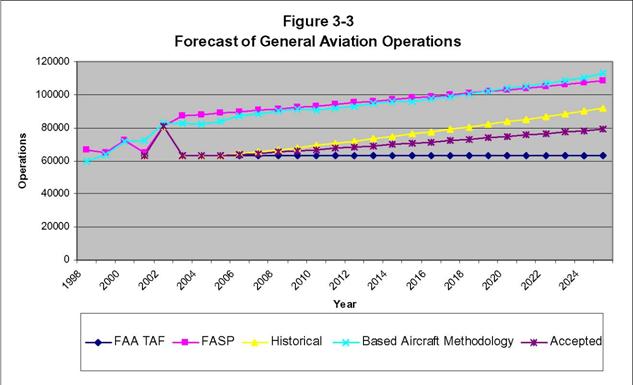
FORECASTS................................................... 3-20 FIGURE 3-3
FORECAST OF GENERAL AVIATION OPERATIONS.....................................
3-23 FIGURE 4-1 JACKSONVILLE SECTIONAL
................................................................................
4-5 FIGURE 4-2 U. S. AIRSPACE CLASSES
........................................................................................
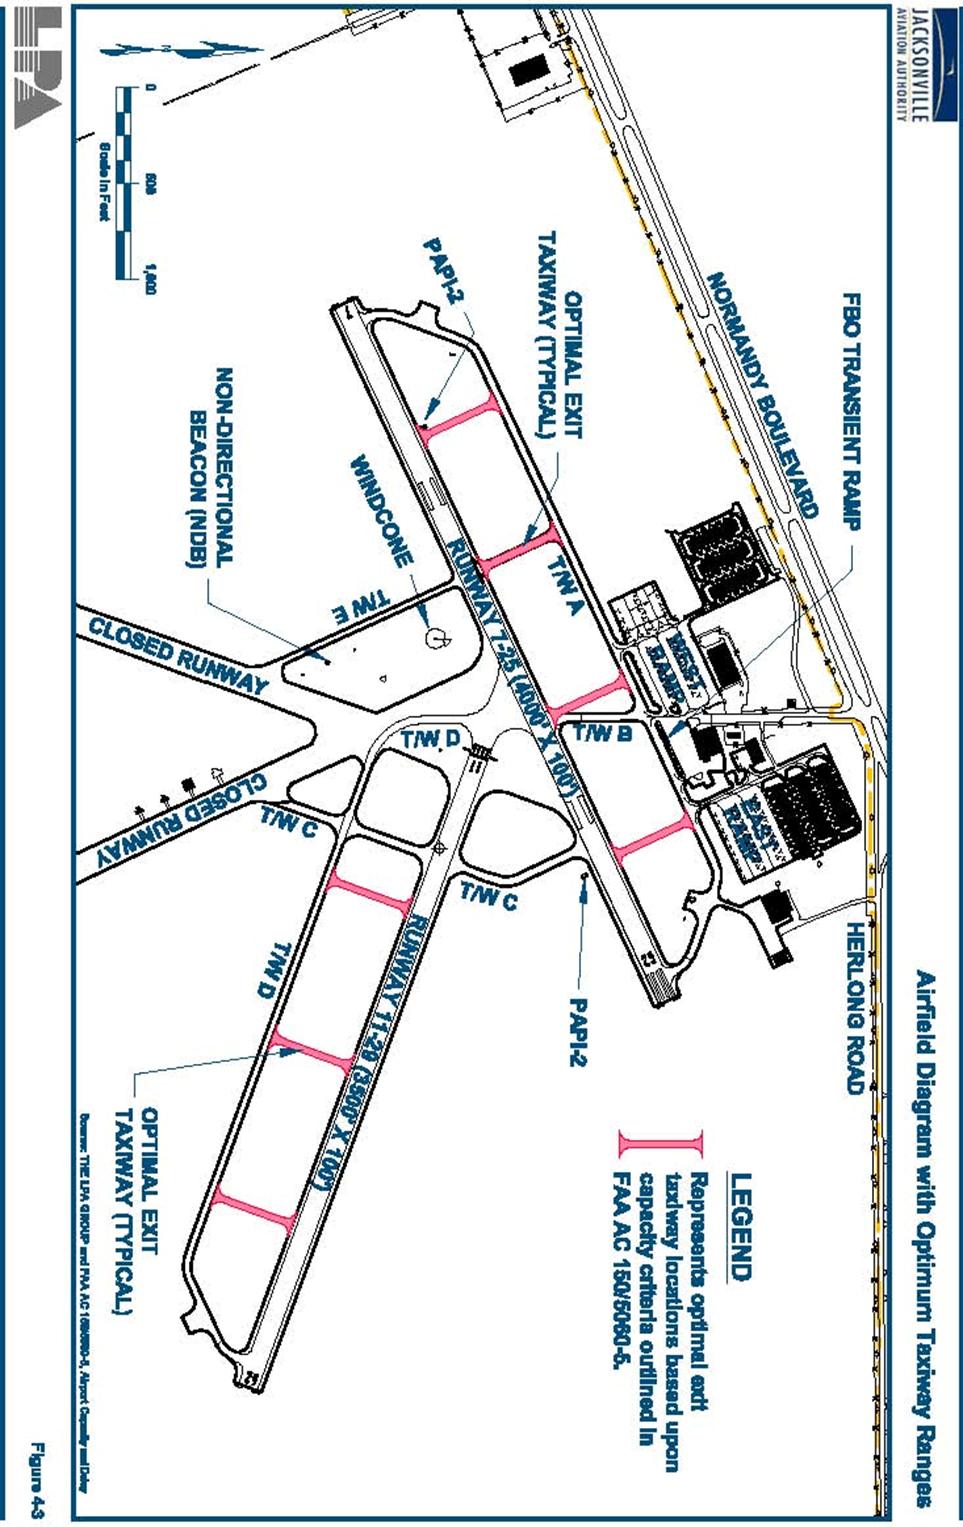
4-6 FIGURE 4-3 AIRFIELD DIAGRAM WITH OPTIMUM TAXIWAY RANGES
...................... 4-10 FIGURE 4-4 CAPACITY LEVEL COMPARISON
...................................................................... 4-19
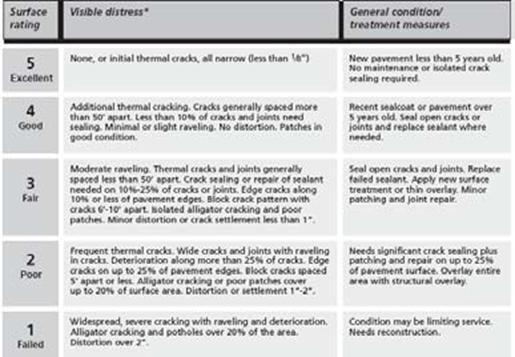
FIGURE 4-5 PAVEMENT RATING
MATRIX.............................................................................
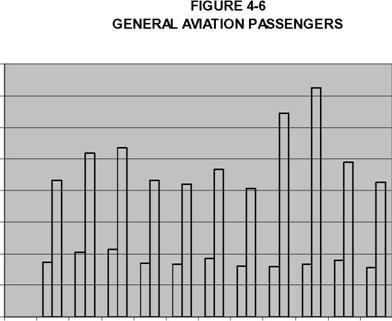
4-33 FIGURE 4-6 GENERAL AVIATION PASSENGERS
.................................................................. 4-57
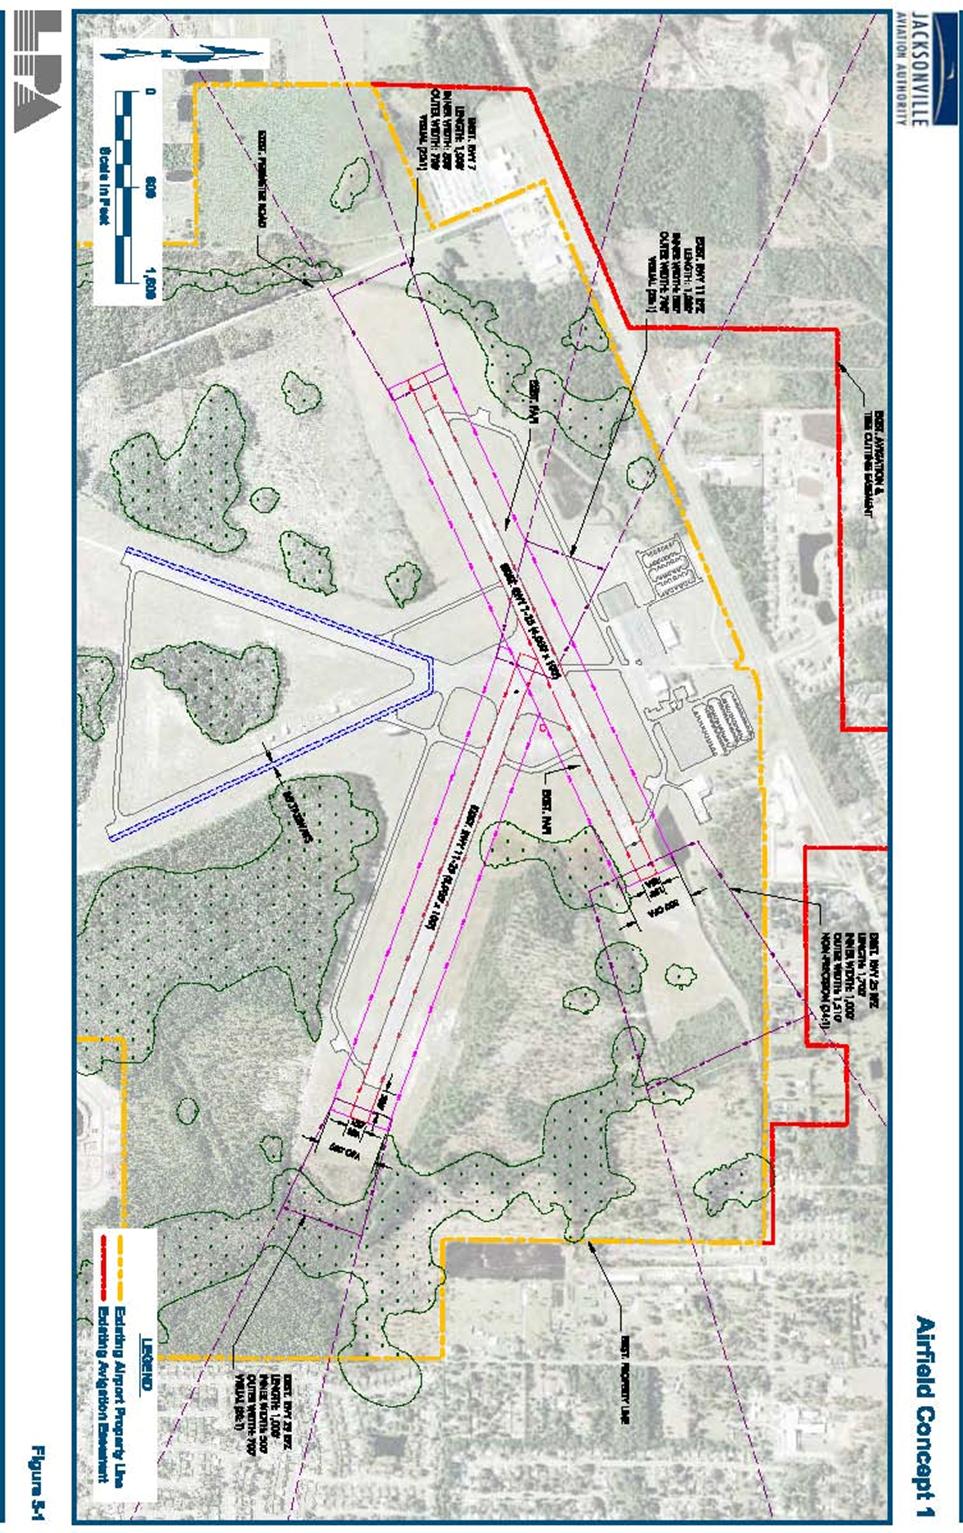
FIGURE 5-1 AIRFIELD CONCEPT 1
..........................................................................................
5-16 FIGURE 5-2 AIRFIELD CONCEPT 2
..........................................................................................
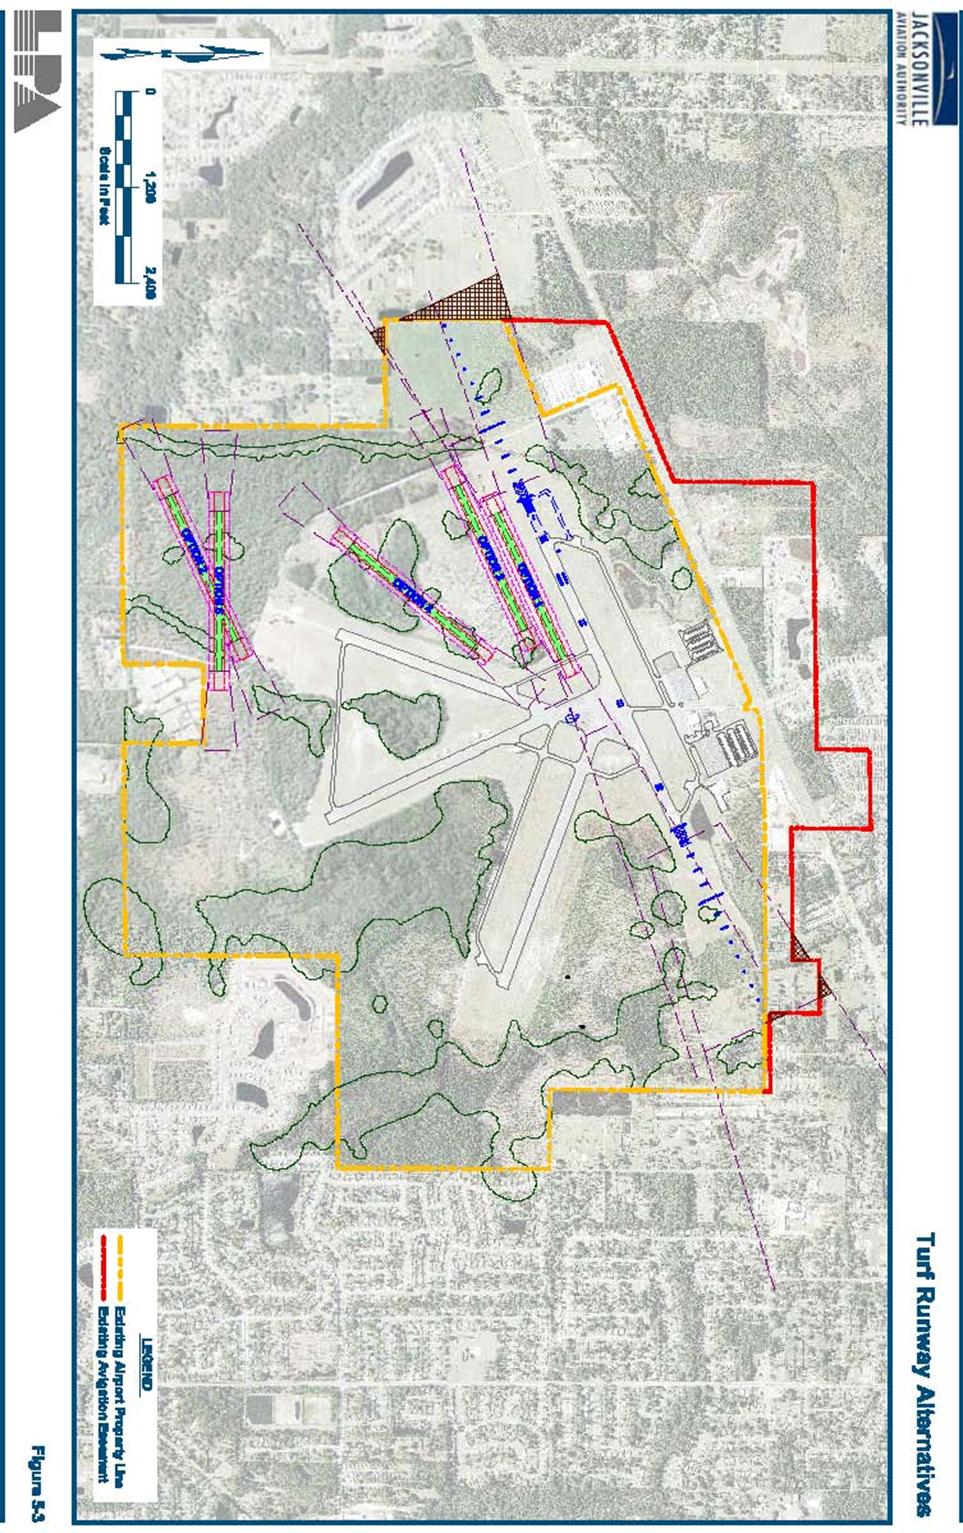
5-20 FIGURE 5-3 TURF RUNWAY ALTERNATIVES
....................................................................... 5-25
FIGURE 5-4 AIRFIELD CONCEPT 3
..........................................................................................
5-27 FIGURE 5-5 PREFERRED AIRFIELD CONCEPT
................................................................... 5-39
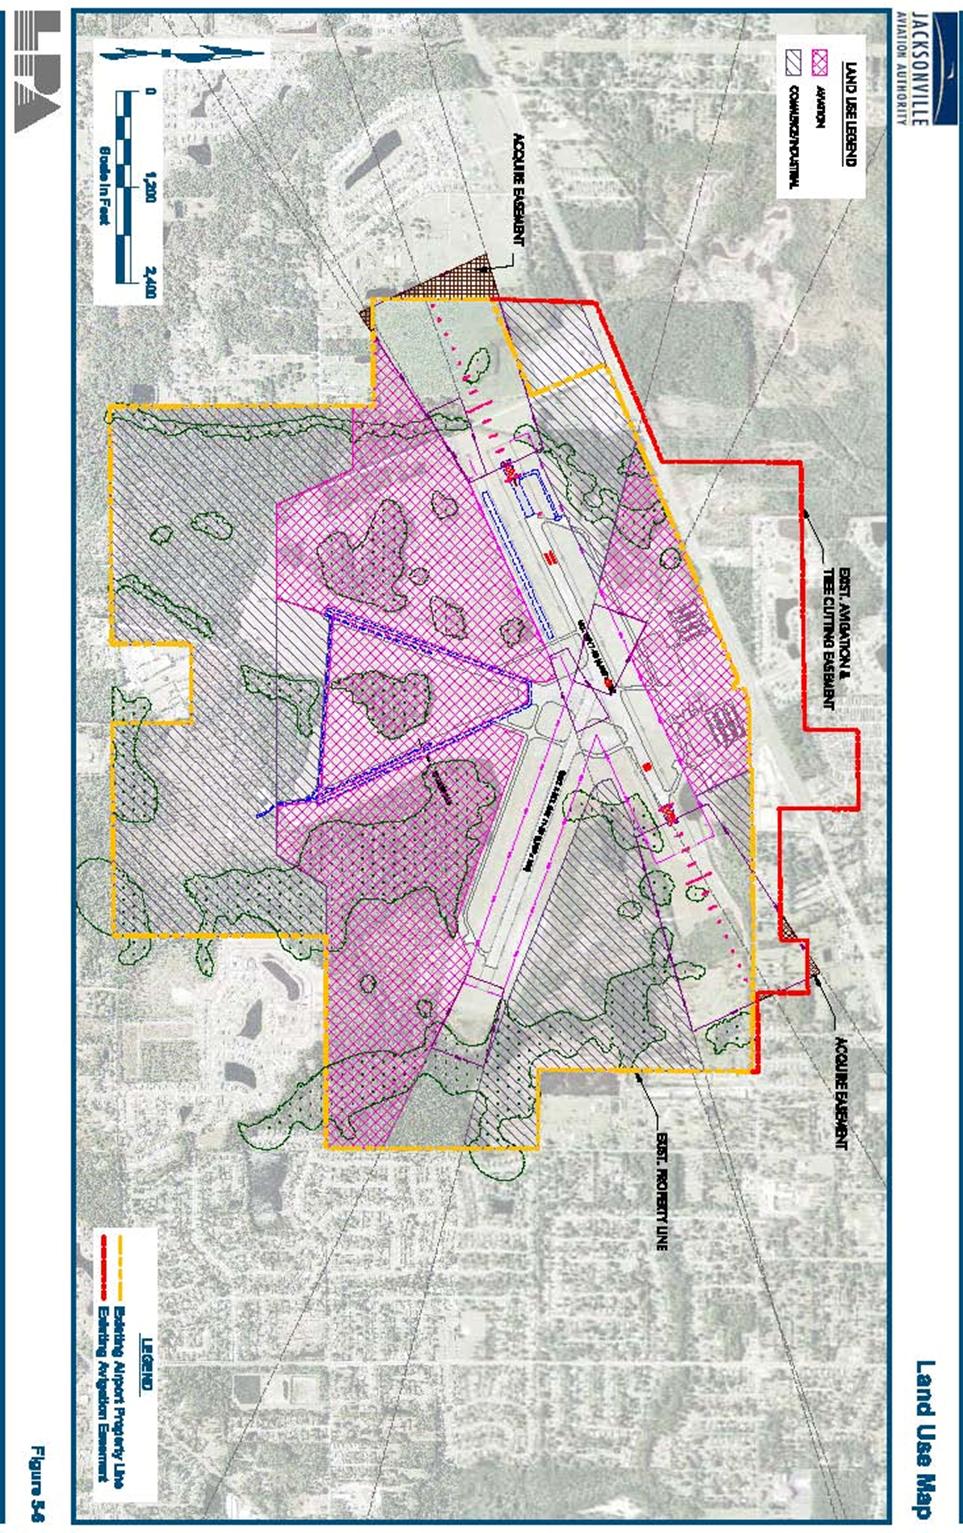
FIGURE 5-6 LAND USE MAP ........................................................................................................
5-40 |
|
|
|
|
|
FIGURE
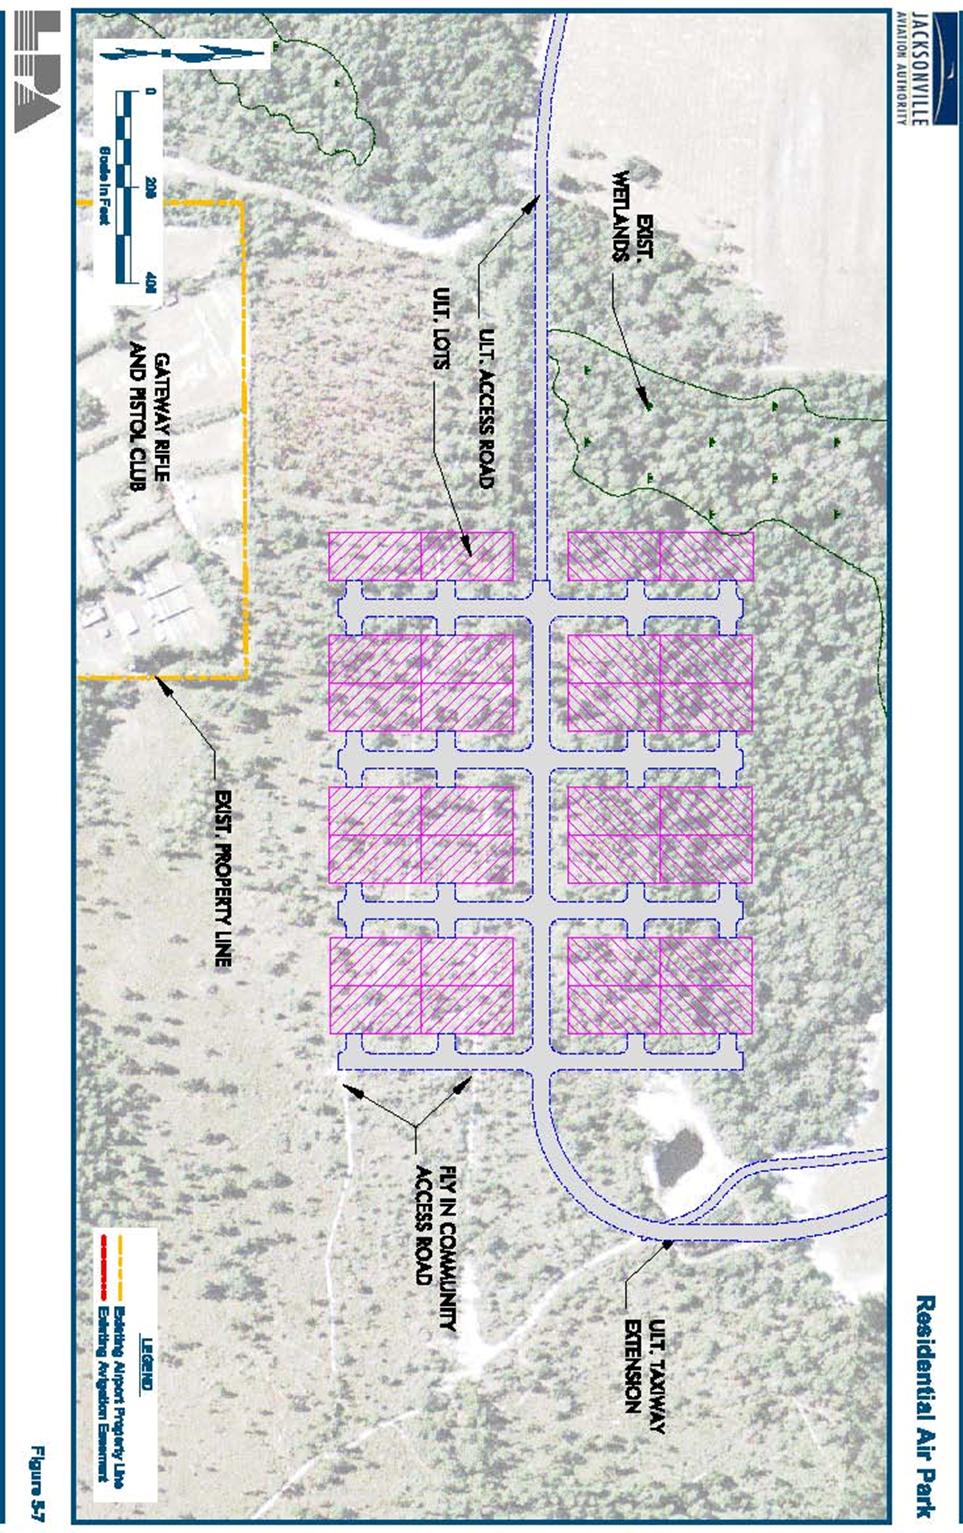
5-7 RESIDENTIAL AIR PARK .....................................................................................
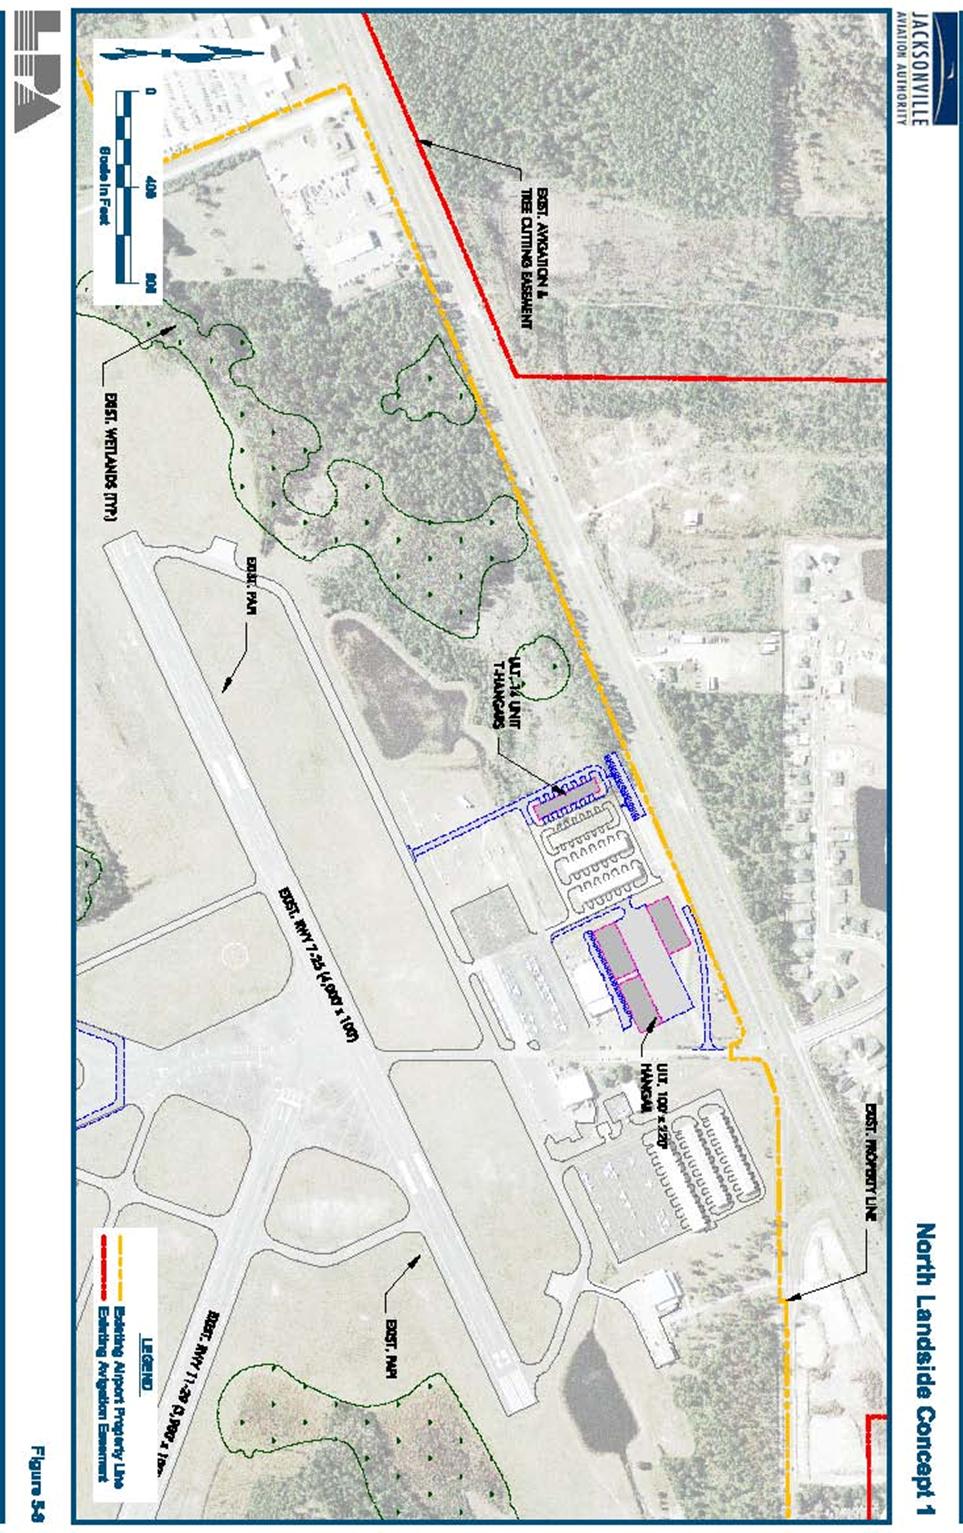
5-45 FIGURE 5-8 NORTH LANDSIDE CONCEPT 1
..........................................................................
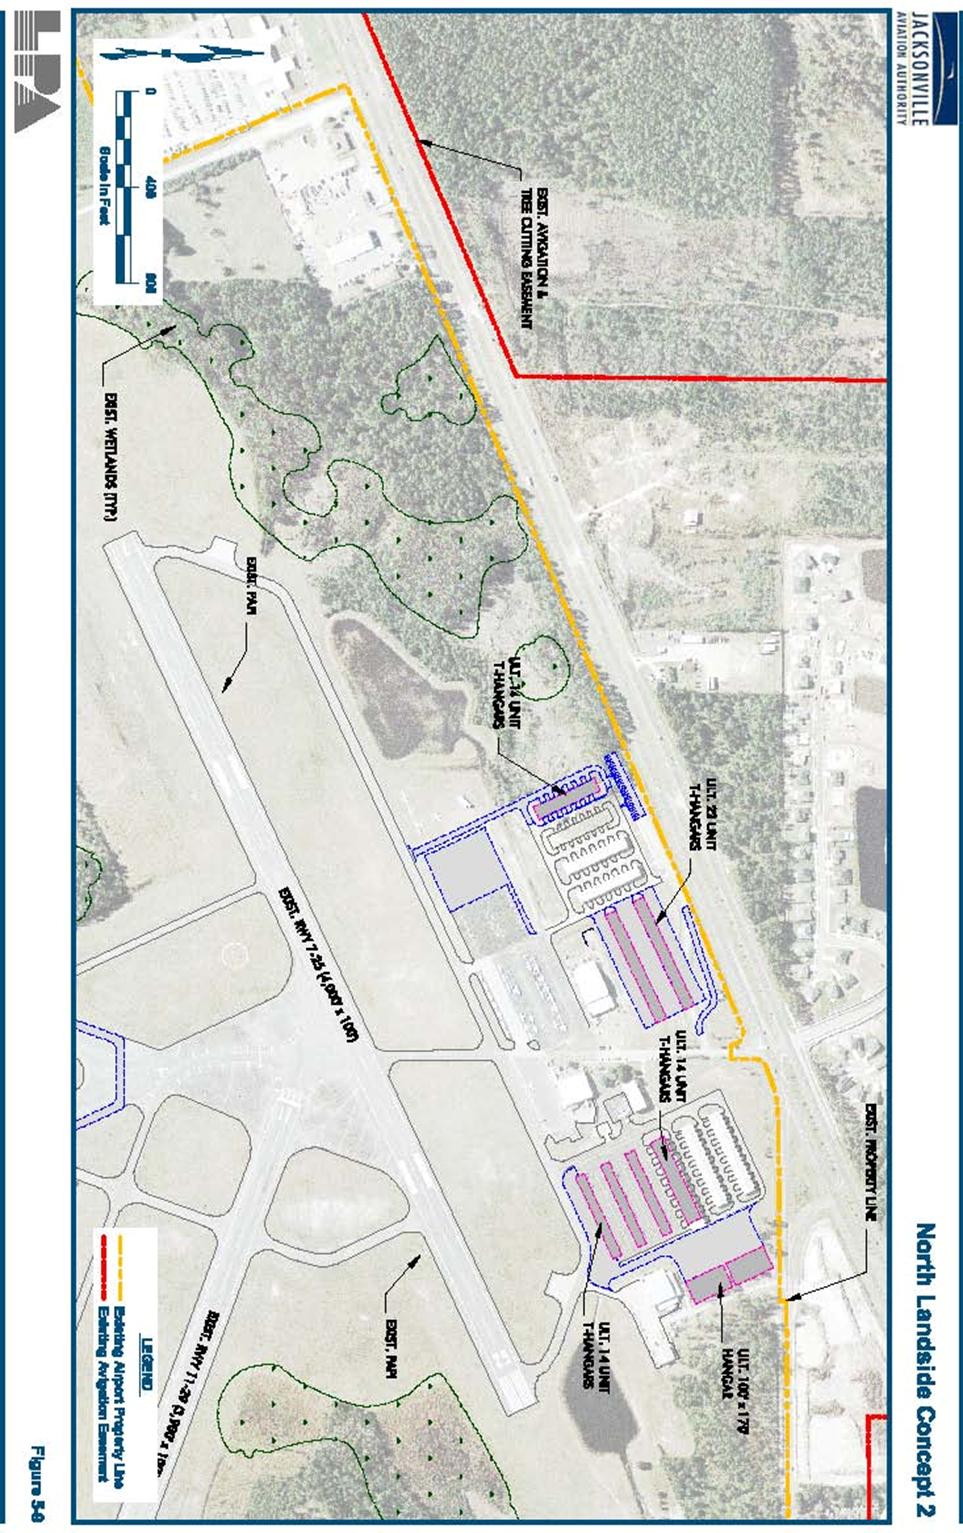
5-53 FIGURE 5-9 NORTH LANDSIDE CONCEPT 2
..........................................................................
5-56 FIGURE 5-10 NORTH LANDSIDE CONCEPT 3
..........................................................................
5-59 FIGURE 5-11 MIDFIELD CONCEPT 1
..........................................................................................
5-65 FIGURE 5-12 MIDFIELD CONCEPT 2
..........................................................................................
5-71 FIGURE 5-13 WEST INDUSTRIAL ZONE
....................................................................................
5-76 FIGURE 5-14 EAST COMMERCE PARK
......................................................................................
5-78 FIGURE 5-15 SOUTH INDUSTRIAL PARK
..................................................................................
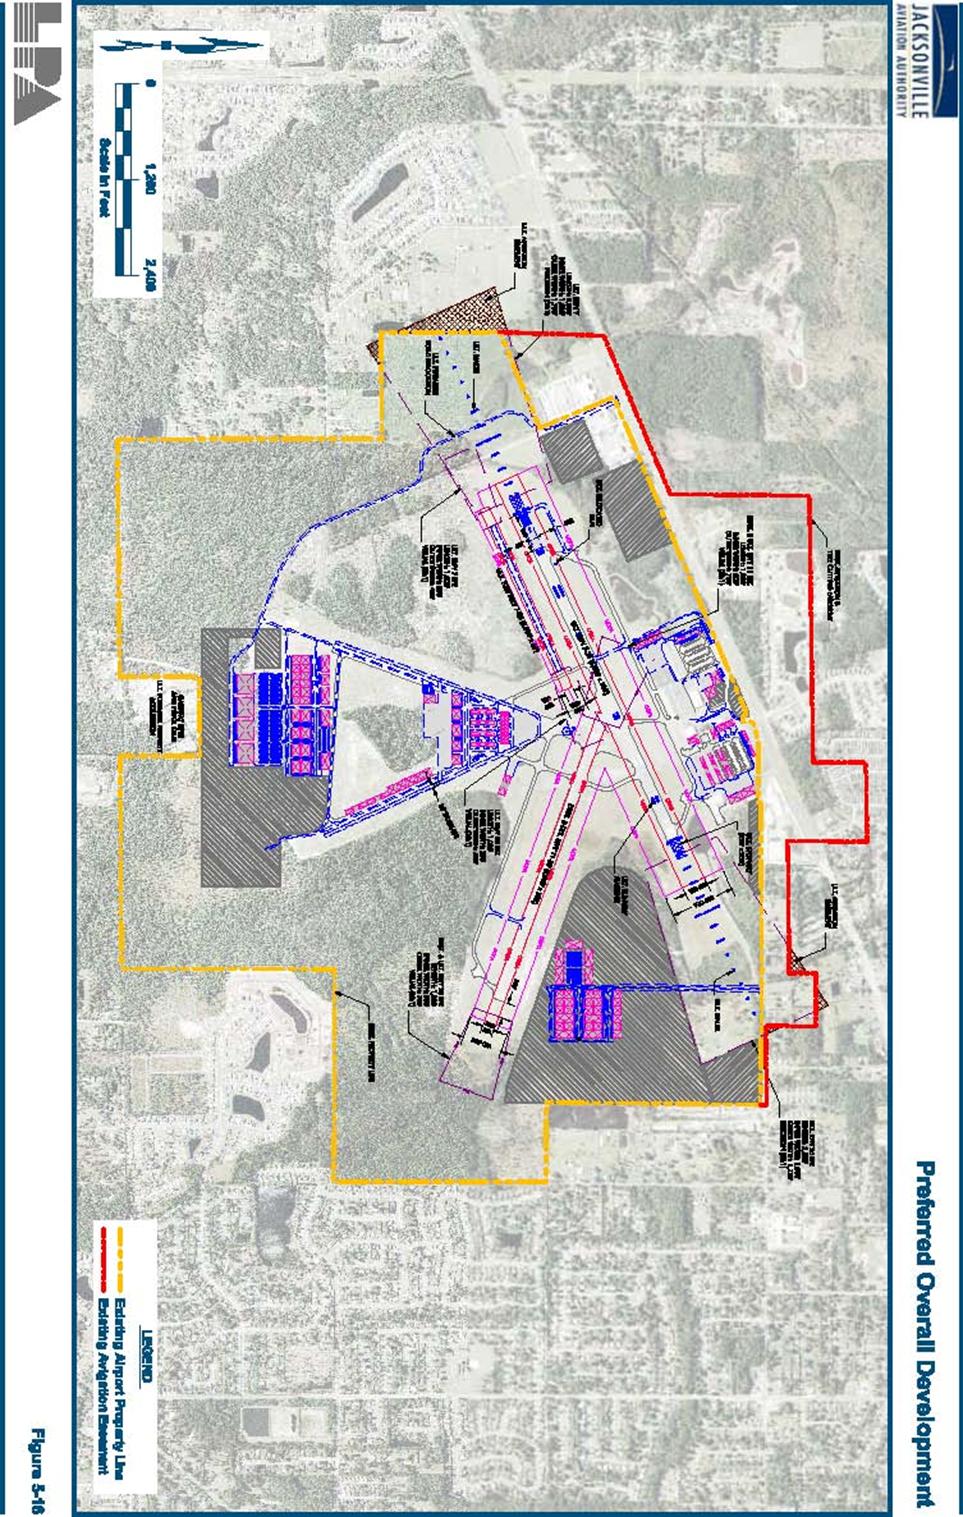
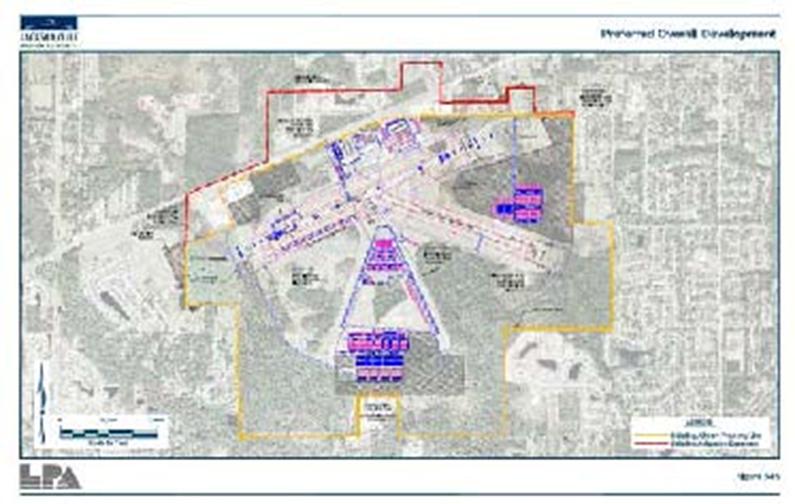
5-82 FIGURE 5-16 PREFERRED OVERALL DEVELOPMENT
......................................................... 5-88 AIRPORT LAYOUT
PLAN COVER SHEET
(1)..............................................................................
6-6 AIRPORT LAYOUT PLAN DRAWING SHEET (2)
........................................................................ 6-7
AIRPORT LAYOUT PLAN DATA SHEET (3)
.................................................................................
6-8 AIRPORT LAYOUT PLAN TERMINAL AREA DRAWING (4) ...................................................
6-9 AIRPORT LAYOUT PLAN INNER APPROACH RUNWAY 7-25 (5)
........................................ 6-10 AIRPORT LAYOUT PLAN INNER
APPROACH RUNWAY 11-29 (6) ....................................... 6-11
AIRPORT LAYOUT PLAN AIRSPACE DRAWING (7)
................................................................ 6-12 AIRPORT
LAYOUT PLAN ON AIRPORT LAND USE (EXISTING)
(8).................................... 6-13 AIRPORT LAYOUT PLAN ON AIRPORT
LAND USE (FUTURE) (9) ...................................... 6-14 AIRPORT
LAYOUT PLAN AIRPORT PROPERTY MAP (SHEET 1 OF 2) (10) ......................
6-15 AIRPORT LAYOUT PLAN AIRPORT PROPERTY MAP (SHEET 2 OF 2) (11)
...................... 6-16 |
|
|
|
|

|
|
|
|
|
|
|
INTRODUCTION |
|
Due to
recent changes at the Airport and areas surrounding its environs, the
Jacksonville Aviation Authority (JAA) undertook an update of the Master Plan
for Herlong Airport (HEG), which was previously updated in 2000. One of the
primary reasons for the update is based upon the Federal Aviation
Administration requirements associated with airports receiving development
grants to conduct periodic updates to their airport development plans. In
addition, Duval County is experiencing a tremendous increase in residential
relocation that has resulted in an increase in construction of residential
and commercial developments around the airport. |
|
GENERAL GUIDELINES |
|
The goal of
the master plan update is to define current and future aviation demand at
HEG, the means and alternatives for addressing this demand, the role of the
airport in the local, regional and national aviation system, and the need for
and financial feasibility of new infrastructure and airport facilities. This
project was funded with grants from the U.S. Department of Transportation
Federal Aviation Administration (FAA), the Florida Department of
Transportation (FDOT) and the Jacksonville Aviation Authority (JAA) and was
programmed to begin in 2005 with completion of the study by the end of 2006. |
|
The airport’s
master plan serves a variety of functions including projecting future
aviation activity and development as a financial planning tool and guiding
on-airport and adjacent land uses. The primary objective of the master plan
update is to create a 20-year development program that will maintain a safe,
efficient, economical, and environmentally acceptable airport facility for
the JAA, City of Jacksonville, and Duval County. By achieving this objective,
the document should provide guidance to satisfy general aviation demand in a
financially feasible and responsible manner. This chapter provides general
direction to the study with respect to the development of concepts and plans
relating to the future development of Herlong Airport. The general approach
is to consider alternative airport development plans, necessary to provide a
“balanced” airport system. |
|
|
|
August 2007 Final
Report |
|
|
|
KEY ISSUES |
|
Overall, this
master plan provides a comprehensive overview of the airport’s needs during
the next 20 years, including issues related to the timing of proposed
development, costs for this development, methods of financing, management
options, and a clear plan of action.
Prior to the start of this master plan update, key issues within the
functional categories of facilities, business, operational, properties and
environmental issues, were identified by Airport Management as requiring
attention, including: |

|
|
|
August 2007 Final
Report |
|
|
|
4
Conduct
review of the land area needs of the airport, and the potential absorption of
land |
|
for aviation related development. 4
Conduct review of land use on and
adjacent to the airport for possible impacts. 4 Consider potential relocation of Gateway NFLE and
Pistol Club. 4 Develop
a current and up-to-date Property Map (formerly Exhibit A). |
|
.
Environmental Issues 4
Provide overview of environmental
factors that may act to limit or guide the development of airport property. 4
Obtain inventory of permitted projects
including existing on-airport ponds. |
|
GOALS AND OBJECTIVES |
|
The overall
goal of the master plan update is to provide HEG with detailed planning
guidance to ensure that Airport facilities and associated land uses will be
adequate to meet short-, intermediate-, and long-term aviation demand. This
document will serve as a management guide for the implementation of necessary
improvements to meet potential aviation activity demand over a planning
period of 20+ years, through the end of 2025. |
|
The key objectives associated with this study
include: |
|
4
Identify
the needed airside, landside, and airspace improvements and recommend options
to further optimize the economic aspects of the airport while enhancing the
safety and operational capability; |
|
4
Establish
an implementation schedule for short-, intermediate-, and long-term
improvements and ensure that they are financially feasible; |
|
4
Identify
short-term requirements and recommend actions to optimize short-term funding
opportunities to be incorporated into the Florida Department of
Transportation (FDOT) Joint Automated Capital Improvement Program (JACIP); |
|
4
Insure
that short-term actions and recommendations do not preclude long-range
planning |
|
options; 4 Incorporate the interests of the public and
government agencies into the planning process; 4 Remain sensitive to the overall environmental
characteristics and needs of the area |
|
surrounding the airport; and 4
Incorporate current comprehensive land
use (both on- and off-airport property) and recommend developments that are
compatible with existing and future land uses. |
|
Therefore, in
order to address the various internal and external factors impacting HEG, a
list of goals was identified based upon the key issues and objectives
impacting HEG in order to provide a guide for the study development. Recommended goals are presented in no
particular order, and, thus, no one goal has priority over the other. |
|
|
|
August 2007 Final Report |
|
|
|
Goal No. 1 |
|
Continue to meet and enhance the level of service
provided to all Airport users. |
|
Objectives: |
|
4 Provide
adequate runway capacity for estimated demand in terms of aircraft type and |
|
annual and hourly operations. |
|
4 Provide
adequate runway length to meet existing and forecast operations needs. |
|
4
Provide opportunities for development
of services associated with potential charter and |
|
corporate GA,
military, flight training, and recreational flying operations. |
|
4 Provide
for potential integration of military and non-military operations. |
|
4
Provide other aviation related support
facilities required for a full range of aviation |
|
services. |
|
4 Provide insight into the estimated future needs of hangar facilities.
|
|
Goal No. 2 |
|
Provide
guidelines for future development, while satisfying anticipated demand. |
|
Objectives: |
|
4 Implementation of non-aviation development to enhance revenue
diversification. |
|
4 Provide
adequate airside and landside facilities to meet anticipated demand. |
|
4 Effectively
market potential commercial and non-commercial aviation facilities. |
|
4
Develop self-sustaining commerce and/or
industrial parks, which will benefit the Airport |
|
and community as a whole. |
|
4
Develop a schematic for incorporating 3rd party
funding for future development. |
|
|
|
August 2007 Final
Report |
|
|
|
Goal No. 3 |
|
Provide an Airport that is safe and reliable. |
|
Objectives: |
|
4
Provide
navigational aids (NAVAIDS) including global positioning system (GPS) and
non-GPS approach options, flight support services, and meteorological
facilities, which enhance the safety and reliability of operations under all
weather conditions. |
|
4
Protect
FAA mandated safety areas, runway protection zones (RPZs), and other clear |
|
zones. 4 Minimize possible obstructions to air navigation. 4
Provide adequate fire fighting, rescue
and emergency services, access roads, facilities, |
|
equipment, and personnel to maintain minimum
response time under all conditions. 4 Ensure that airside and landside operations and
facilities meet all applicable security |
|
standards. 4 Ensure that aircraft parking facilities are
adequately sized and easy to negotiate. 4 Develop facilities to meet the demands of the
current and future critical aircraft. 4 Address the need and timeline for a control tower
with the expected development of the |
|
SATS and Air Taxi segments of the industry. |
|
Goal No. 4 |
|
Develop the Airport and its vicinity to minimize
negative environmental impacts. |
|
Objective: |
|
4 Identify
the major environmental issues of concern. 4
Minimize potential
environmental impacts, and provide special attention to minimizing noise
impacts, air and water pollution, and wetland impacts. |
|
4
Consider
the use and development of airport property to minimize any adverse impacts
on other environmental concerns while maintaining a safe environment for
users and adjacent land owners (i.e. timber harvesting and wildlife
control). |
|
4
Design
and select noise abatement measures that minimize the number of people
exposed to noise above Day-Night Noise Level (DNL) greater than 65 decibels,
if applicable. |
|
4
In
selecting noise abatement actions, avoid actions that would adversely affect
capacity, impose restrictions on Airport use that would be discriminatory, or
that could erode prudent margins of safety. |
|
4
When
necessary, encourage local construction restrictions to reduce impact of
Airport/aviation. |
|
|
|
August 2007 Final Report |
|
|
|
Goal No. 5 |
|
Promote the development of compatible land use in
undeveloped areas within the Airport vicinity. |
|
Objectives: |
|
4
Promote
land use planning and development objectives, for on- and off-Airport land
use, which are compatible with the anticipated long-range needs of the
Airport and the community as a whole. |
|
4
Designate areas for future development
hangar homes, maintenance, commerce park, etc. 4 Locate Airport facilities so that growth may be
controlled through land-use planning and zoning. 4
Consider the impacts of the Gun Club on
Airport Operations. |
|
Goal No. 6 |
|
Develop an
Airport that supports local and regional economic goals while accommodating
new opportunities or shifts in development patterns. |
|
Objectives: |
|
4
Achieve
a level of service and user convenience such that the Airport is a positive
factor in regional economic development decisions. |
|
4
Achieve
capacities of the airfield, the terminal area systems, and industrial
park/Commerce Park, so that the Airport may be an attractive location for GA,
maintenance, and other aviation related activities. |
|
4
Provide
appropriate and achievable commercial opportunities adjacent to and on the
Airport. |
|
4
To
assure economic feasibility, identify an equitable distribution of user
charges; distribute the burden of capital investment, maintenance, and
operating costs, while keeping overall costs within an acceptable level. |
|
4
Identify
financial alternatives and funding sources available for the implementation
of |
|
aviation and non-aviation projects. 4
Quantify financial resources available
for project funding. 4 Develop
an airport layout plan (ALP) that easily integrates with existing and
proposed |
|
transportation
infrastructure, to encourage economic growth. |
|
|
|
August 2007 Final Report |
|
|
|
Goal No. 7 |
|
Minimize
aircraft delay associated costs to all airfield users (i.e. military
operations, recreational pilots, experimental aircraft, flight training
facilities, etc.). |
|
Objectives: |
|
4
Minimize
airspace congestion and delays for GA aircraft through procedural changes
and/or provision of additional NAVAIDS. |
|
4 Minimize airside congestion through construction of
runways, taxiways, and aprons, when the costs of providing the additional
capacity are less than the additional operating costs associated with aircraft
delays. |
|
Goal No. 8 |
|
Ensure
adequate and convenient ground access to the Airport. |
|
Objectives: |
|
4
Provide safe access and easy-to-follow
signs to Airport roadways and facilities. 4 Provide adequate lane capacity on roads leading to
the Airport, to serve existing and future activity. 4
Provide adequate land capacity on
internal circulation roadways serving functional areas (terminal, GA,
commerce park, etc.). 4 Provide
parking facilities (for GA, terminal, commerce park, etc.) that are
conveniently located and easily accessible. 4 Maintain close coordination with Regional Planning
Council, Metropolitan Planning Organizations (MPO), FDOT, and other
transportation groups. |
|
These goals
and objectives reflect policy goals to be reached through the master planning
process. They include the ultimate development of self-supporting facilities
to serve the existing and future aviation needs of the region; the
achievement of compatible land uses in the vicinity of the Airport; and
provisions for the type of development that will yield the most public
benefit of the investment represented by the Airport. Finally, these goals
must be manageable within existing limitations of funds and design
principles. |
|
As noted, the
airport is located within a residential populated area and, therefore, any
future developments identified in this study will consider potential
community impacts. Considering this,
to ensure community and government participation in this study, a Technical
Advisory Committee (TAC) |
|
|
|
August 2007 Final Report |
|
|
|
was created
to provide technical review of the working papers and to provide input into
the entire master plan process. The committee was assembled by Airport
Management and includes representatives from JAA, FAA, FDOT, City of
Jacksonville, Duval County, airport tenants and the public/community.
Multiple opportunities will be available for community and governmental
representatives to participate in this study, including through
representatives serving on the study’s technical advisory committee and
through three public meetings held in conjunction with the CPAC
meetings. It is important to note that
the study results and the future developments presented in this report
represent a plan to guide the Jacksonville Aviation Authority in meeting
demand as they develop; therefore, no development should be undertaken until
there is a clearly identified need for it. |
|
REGULATORY GUIDELINES |
|
This Master Plan
is prepared in accordance with Federal Aviation Administration (FAA) Advisory
Circulars AC 150/5370-6B, Airport Master Plans, and AC
150/5300-13, Change 10, Airport Design, in
conjunction with the FDOT’s Guidebook for Airport Master Planning and
other related standards. Furthermore, current guidance will be incorporated
from the FAA Airports District Office (Orlando), FDOT Aviation Office, JAA,
and other local government agencies. Planning efforts of the city, county,
region, state, and nation have been coordinated in the Master Plan to provide
the most preeminent plan for the benefit of HEG and all of the participating
organizations. |
|
In addition,
in order to assist JAA in considering the environmental factors that may
impact future development at HEG, the following national, state and local
legislation was considered. This
overview of regulatory guidelines will assist the sponsor and the planning
consultant in developing alternatives that are tailored to the airport’s
size, unique setting and operating environment while also considering the
airport’s environmental setting, the identification of environmentally
related permits and the potential impacts of recommended development
projects. An in-depth analysis of
existing environmental conditions at HEG is provided in Chapter Two, Inventory
of Existing Conditions. |
|
Water Quality |
|
Legislation |
|
The Federal
Water Pollution Control Act, as amended by the Clean Water Act provides the
authority to establish water control standards, control discharges into
surface and subsurface waters, develop waste treatment management plans and
practices, and issue permits for discharges and for dredged and filled
materials into surface waters. The
Fish and Wildlife Coordination Act requires consultation with the United
States Fish and Wildlife Service (USFWS) and the Florida Fish and Wildlife
Conservation Commission (FFWCC) when any alteration and/or impounding of
water resources is expected. The Federal National Pollution Discharge
Elimination System (NPDES) permit program provides regulations that govern
the quality of stormwater discharges into water resources of the United
States. |
|
|
|
August 2007 Final
Report |
|
|
|
Regulatory Agencies |
|
The United
States Army Corps of Engineers (COE), the Florida Department of Environmental
Protection (FDEP), and the Saint Johns River Water Management District
(SJRWMD) have jurisdiction over and regulate activities that alter the
landscape and disrupt water flow to wetland areas and surface waters through
the Environmental Resource Permitting (ERP) Program in Florida. The program
forwards permit applications to other state and federal agencies including
the FFWCC and the USFWS. Permitting
requirements for construction that exceeds five acres are specified by NPDES
regulations and administered by the FDEP.
|
|
Historical, Architectural,
Archaeological, and Cultural Resources |
|
Legislation |
|
The National
Historic Preservation Act of 1966 and the Archaeological and Historic
Preservation Act of 1974 provide protection against development impacts that
would cause change in historical, architectural, archaeological, or cultural
resources. |
|
Regulatory Agencies |
|
The
Department of State, Division of Historical Resources is responsible for
promoting historical, archaeological, museum, and folk culture resources in
Florida. |
|
Biotic Communities |
|
Legislation |
|
The Fish and
Wildlife Coordination Act (48 Statute 401 as amended; 16USC et. Seq.)
considers impacts to habitat and wildlife.
Section 2 of this act requires consultation with USFWS, the United
States Department of the Interior (USDI), and state agencies that regulate
wildlife whenever water resources are modified by a federal, public, or
private agency under federal permit of license. |
|
Regulatory Agencies |
|
The USFWS
and FFWCC have authority under the act to provide comments and
recommendations concerning vegetation and wildlife resources. |
|
|
|
August 2007 Final
Report |
|
|
|
Endangered and Threatened Species |
|
Legislation |
|
The
Endangered Species Act of 1973 (ESA), as amended, requires federal agencies,
in consultation with and assisted by the USFWS, to ensure that their actions
are not likely to jeopardize the continued existence of listed species or
result in the destruction or adverse modification of critical habitat of such
species. Section 7 of the Act states
that federal agencies must review their actions: If those actions will affect
a listed species or its habitat, they must consult with the United States
Fish and Wildlife Service. |
|
Regulatory Agency |
|
The USFWS,
the Florida Department of Agriculture and Consumer Services (FDACS), and the
FFWCC have jurisdiction over and administer native endangered and threatened
species permits for Florida. During the consultation process, the USFWS will
determine the significance of potential impacts to federally protected
species and will recommend methods to avoid or mitigate for impacts that may
occur as a result of the proposed projects.
|
|
The FFWCC
Threatened and Endangered Species Section reviews and issues permits that
involve Florida’s protected terrestrial animal species. The FFWCC Bureau of Protected Species
Management reviews and issues permits that involve Florida’s protected
aquatic wildlife species. The FDACS Division of Plant Industry is responsible
for providing protection to Florida’s protected native plant species that are
classified as endangered, threatened, or commercially exploited. |
|
Wetlands |
|
Legislation |
|
Executive
Order 11990, Protection of Wetlands, mandates that each federal agency take
action to minimize the destruction, loss, or degradation of wetlands, and
preserve and enhance their natural values. On the federal level, wetlands are
regulated according to Section 404 of the Clean Water Act, which requires a
permit for dredging and filling activities that take place in Waters of the
United States, including wetlands. |
|
The legal
framework for the regulation of activities in wetlands by the State of
Florida and by the State’s Water Management Districts is provided, in part,
by Chapter 373 of the Florida Statutes, the Florida Water Resources Act of
1972, specifically 373.414 which states that an activity regulated under
this part will not be harmful to water resources; water quality standards
will not be violated; and such activity in, on, or over surface waters or
wetlands, is not contrary to the public interest. If such an activity significantly degrades
or is within an Outstanding Florida Water, the applicant must |
|
|
|
August 2007 Final
Report |
|
|
|
provide
reasonable assurance that the proposed activity will be clearly in the public
interest. Specifics concerning permit requirements are codified in Chapter
40, parts A through E, of the Florida Administrative Code. |
|
Regulatory Agencies |
|
In Northeast
Florida, the COE, the FDEP, and the SJRWMD have jurisdiction over and
regulate activities that alter the landscape and disrupt water flow to
wetland areas and surface waters through the State ERP Program. |
|
Floodplains |
|
Legislation |
|
Executive
Order 11988, “Floodplain Management” defines floodplains as lowland areas
adjoining inland and coastal waters, especially those areas subject to one
percent or greater chance of flooding in any given year. |
|
Regulatory Agencies |
|
The Federal
Emergency Management Agency (FEMA) has produced Flood Insurance Rate Maps
(FIRMs) for communities participating in the National Flood Insurance
Program. The maps detail the 100-year
and 500-year base flood elevations. The State of Florida administers and
requires compensation for floodplain impacts through the ERP program. SJRWMD has jurisdiction over Northeast
Florida. |
|
Coastal Zone Management Program |
|
Legislation |
|
The Coastal
Zone Management Act (CZMA) aims to preserve, protect, develop, and where
possible, restore and enhance the resources of the nation’s coastal
zone. The Florida Coastal Management
Act of 1978 (Chapter 380, Part II, Florida Statutes) authorized the FDEP to
develop a comprehensive state coastal management program based upon existing
Florida Statutes and Rules. |
|
Regulatory Agency |
|
The FDEP is
responsible for directing the implementation of the Florida Coastal
Management Program (FCMP). The program
is based on a cooperative network of nine agencies including the FDEP, the
Florida Department of Community Affairs (DCA), FFWCC, Department of State
(DOS), Governor’s Office of Planning and Budgeting (OPB), Department of
Transportation (DOT), |
|
|
|
August 2007 Final
Report |
|
|
|
Department of
Health (DOH), and the Division of Forestry within the DACS. SJRWMD is also a cooperating member in the
consistency review process for Northeast Florida. |
|
Farmland |
|
Legislation |
|
The Farmland
Protection Policy Act of 1981 (FPPA) requires the evaluation of farmland
conversion to non-agricultural areas. Prime farmland is land best suited for
producing food, feed, forage, fiber, and oilseed crops. This land has the
quality, growing season, and moisture supply necessary to produce sustained
crop yields with minimal energy and economic input. |
|
Regulatory Agencies |
|
The National
Resources Conservation Service (NRCS) has jurisdiction and should be
consulted if farmland is to be converted to non-agricultural use by a
federally funded project. The
consultation determines whether the farmland is classified as “prime” or
“unique.” If it is, the Farmland
Protection Act requires rating the farmland conversion impacts based upon the
length of time farmed, amount of farmland remaining in the area, level of
local farm support services, and the level of urban land in the area. |
|
MASTER PLANNING PROCESS |
|
The Master
Plan provides an effective written and graphic representation of the ultimate
development of the Airport and associated land uses adjacent to the Airport,
while establishing a schedule of priorities and phasing for the various
improvements proposed. The planning document presents a conceptual
development plan, over a 20+-year period, for the Airport. Realistic master
planning is a continuing and evolutionary process due to the justification
and funding required during the implementation process. Many adjustments are
likely to take place to meet the changing industry before facilities are designed,
approved, and built to completion. |
|
An approved
Airport Master Plan provides long-range recommendations for development of an
airport and is essential for an airport to qualify for federal and/or state
assistance for realization of the plan. Government assistance is provided in
the form of financial grants to the airport sponsor. The grants are provided
by the FAA through the Airport Improvement Program (AIP) funded by the
Federal Aviation Trust Fund and by the FDOT through the Aviation Fuel Tax that
funds approximately 60 percent of the State Aviation Program and through the
Public Transportation Fund for the remaining 40 percent. |
|
This master
plan update provides a systematic outline of the development actions required
to maintain and further develop airfield and landside facilities. This process provides the officials
responsible for |
|
|
|
August 2007 Final
Report |
|
|
|
scheduling,
budgeting and ultimate funding of airport improvement projects with an
advance notice of the future needs of the Airport. By phasing airport
improvements, the development can be conducted in an orderly and timely
fashion. |
|
To accomplish
the objectives identified, the study included the following tasks: |
|
4 Conduct
an inventory of existing documents related to the airport, the physical
airport facilities, demographics of the airport service area, and airport
environment; 4 Collect historical operational
data, conducting tenant interviews, and forecasting aviation activity through
the year 2025; |
|
4
Conduct
a comprehensive analysis of current airport facilities, determination of
trends and activities affecting the airport, the identification and analysis
of potential trends in the aviation industry including potential impacts to
future operations; |
|
4 Evaluate
and compare the airfield capacity to expected aviation activity; 4 Determine
the airport facilities required to meet forecast demand; 4 Create
a concise Airport Layout Plan (ALP) drawing set reflecting the proposed |
|
improvements throughout the master planning time
period 4 Compile a schedule of the
proposed improvements, including cost estimates, phasing and financial
feasibility of each proposed improvement; and 4 Develop a cost feasible Capital Development Plan
(CIP) in FDOT JACIP Format. |
|
A graphic
representation of this process is depicted in Figure 1-1, Steps in
the Master Planning Process. |
|
Throughout this process, reviews of the master plan
report were conducted at key points such as at the completion of the
forecasts and during development of the alternatives. This ensured that input was received from
key stakeholders, such as JAA, FAA and FDOT.
The individual report chapters provide a detailed explanation of these
key steps. It should be noted that
each step in the master plan process was built upon information and decisions
made during the previous steps. Taken
as a whole, the master plan process addressed key issues as identified above
as well as illustrated how the study objectives were met. |
|
|
|
August 2007 Final Report |
|
|
|
Figure
1-1 |
|
Steps in the Master Planning Process |
|
|
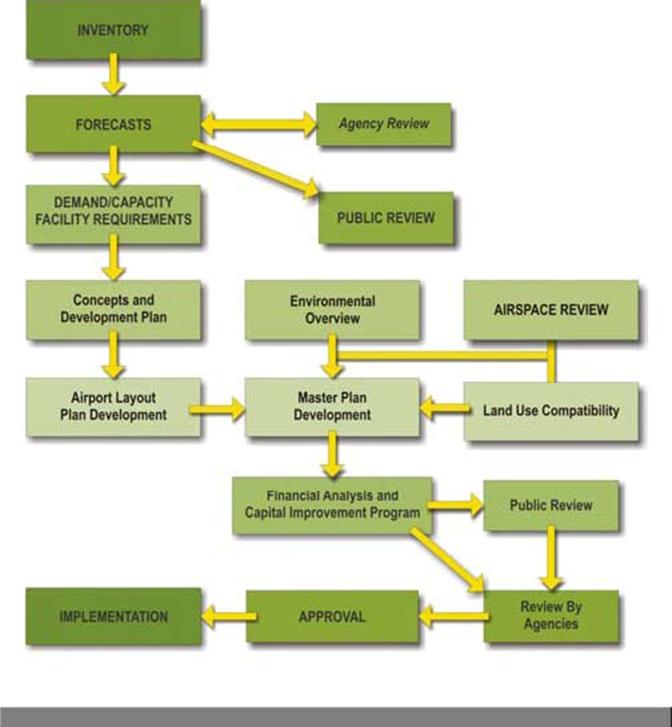
|
August 2007 Final
Report |
|
|

|
|
|
|